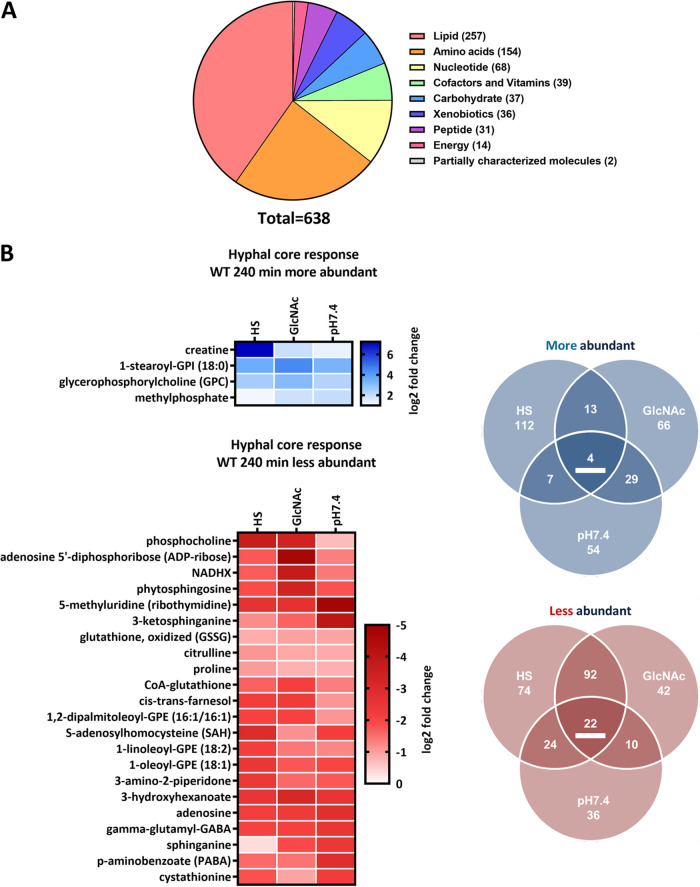
FIG 3.
Metabolite categorization and metabolic core response of WT hyphae after 240 min. (A) Metabolites detected in this study grouped by their respective “superpathways.” (B) Metabolites affected by the yeast-to-hypha transition in elongated hyphae (HS and GlcNAc versus SD, pH 7.4 versus pH 4) after 240 min. Only metabolites meeting the threshold of a P value of <0.05 are displayed. More abundant metabolites are indicated in blue, and less abundant metabolites are indicated in red. Abundance changes (log2) of the respective core set metabolites (underlined in the Venn diagram) are displayed.

