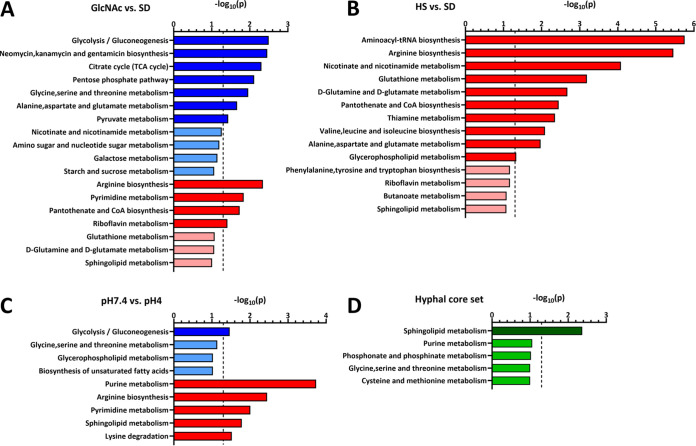
FIG 4.
KEGG pathway enrichment analysis for metabolites altered in abundance during WT hypha formation. Metabolites significantly affected in abundance (P < 0.05) under the indicated conditions (WT, 240 min) (GlcNAc versus SD [A], HS versus SD [B], pH 7.4 versus pH 4 [C], and metabolic core set [D]) with a unique HMDB identifier were used to identify enriched KEGG pathways via “MetaboAnalyst” enrichment analysis. The analysis was performed twice for each comparison with more abundant (blue) or less abundant (red) metabolites or both (green) for the core set. Blue bars indicate potentially less active pathways, and red bars indicate more active pathways. Enriched pathways are indicated for two cutoff values: P < 0.05 (dark colors) and 0.05 < P < 0.1 (light colors). Dashed lines indicate the canonical significance threshold [P = −log10(0.05)].

