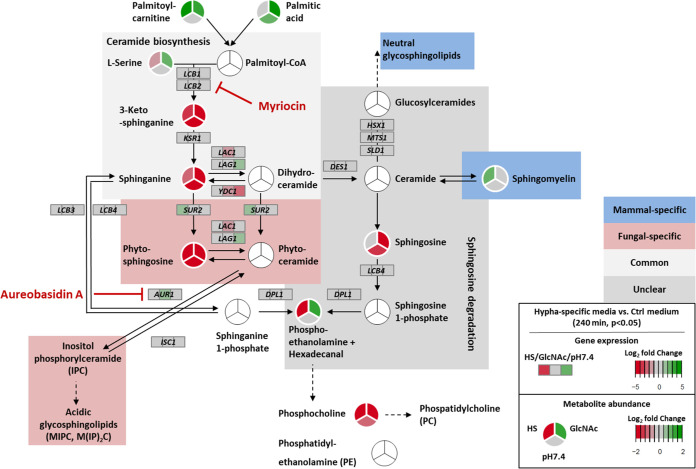
FIG 6.
C. albicans sphingolipid biosynthesis is activated during filamentation. Combined projection of transcriptional and metabolic changes of the sphingolipid biosynthesis pathway, indicating depletion of the consecutive initial intermediates—3-ketosphinganine, sphinganine, and phytosphingosine—during WT filamentation, caused by increased pathway activity for the synthesis of required sphingolipids. Circles (for metabolites) or rectangles (for gene expression) are split, displaying the three hyphal conditions (GlcNAc and HS versus SD, pH 7.4 versus pH 4) at 240 min. Green shades indicate gene induction/increased metabolite abundance, and red shades indicate gene repression/lowered metabolite abundance. Changes not meeting the significance threshold (P < 0.05) are shown in gray. White circles represent metabolites not detected in our study. Target points of the inhibitors myriocin and aureobasidin A are indicated.

