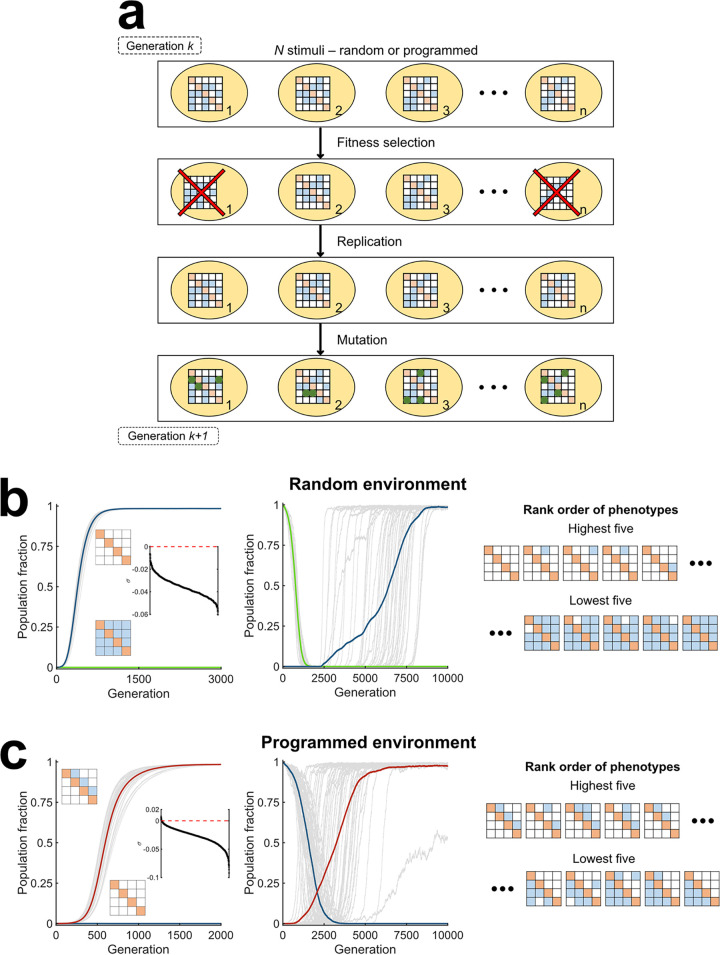
FIG 3.
Stochastic evolutionary dynamics simulations show selection of cross talk in programmed environments and specificity in random environments. (a) Schematic of Wright-Fisher simulations. Simulations proceed in discrete generations and with fixed populations (n) comprising bacteria of different phenotypes, indicated by their interaction matrices. In each generation, bacteria are exposed to stimuli. Depending on their response, fitness selection takes place and less fit bacteria are eliminated. Lost bacteria are replaced with copies of selected ones, chosen randomly. The resulting bacteria mutate, illustrated using green boxes in the interaction matrices, resulting in altered phenotypes, which form the substrate for selection in the next generation. (b) Evolution in a random environment. The phenotype without any cross talk (blue) gets fixed whether the initial population is homogeneous (left) or mixed (middle). The phenotype with all cross talk interactions is also shown for comparison (green). The gray lines are trajectories of the two phenotypes in each of 50 realizations. The thick lines are means. Trajectories of all other phenotypes are not shown. The cross talk strength was set to γ = 0.26. The inset in the left plot is the rank-ordered selection coefficient of all the phenotypes. The interaction matrices of the five most and five least fit phenotypes are shown (right). (c) Evolution in a programmed environment. The one-way cross talk phenotype mirroring the signal sequence I1→I2→I3→I4, which has the highest fitness, dominates the population (red), whether the initial population is homogeneous (left) or mixed (middle). The inset in the left plot is the rank-ordered selection coefficient of all the phenotypes. The interaction matrices of the five most and five least fit phenotypes are depicted (right). Simulations used N = 4 TCSs.

