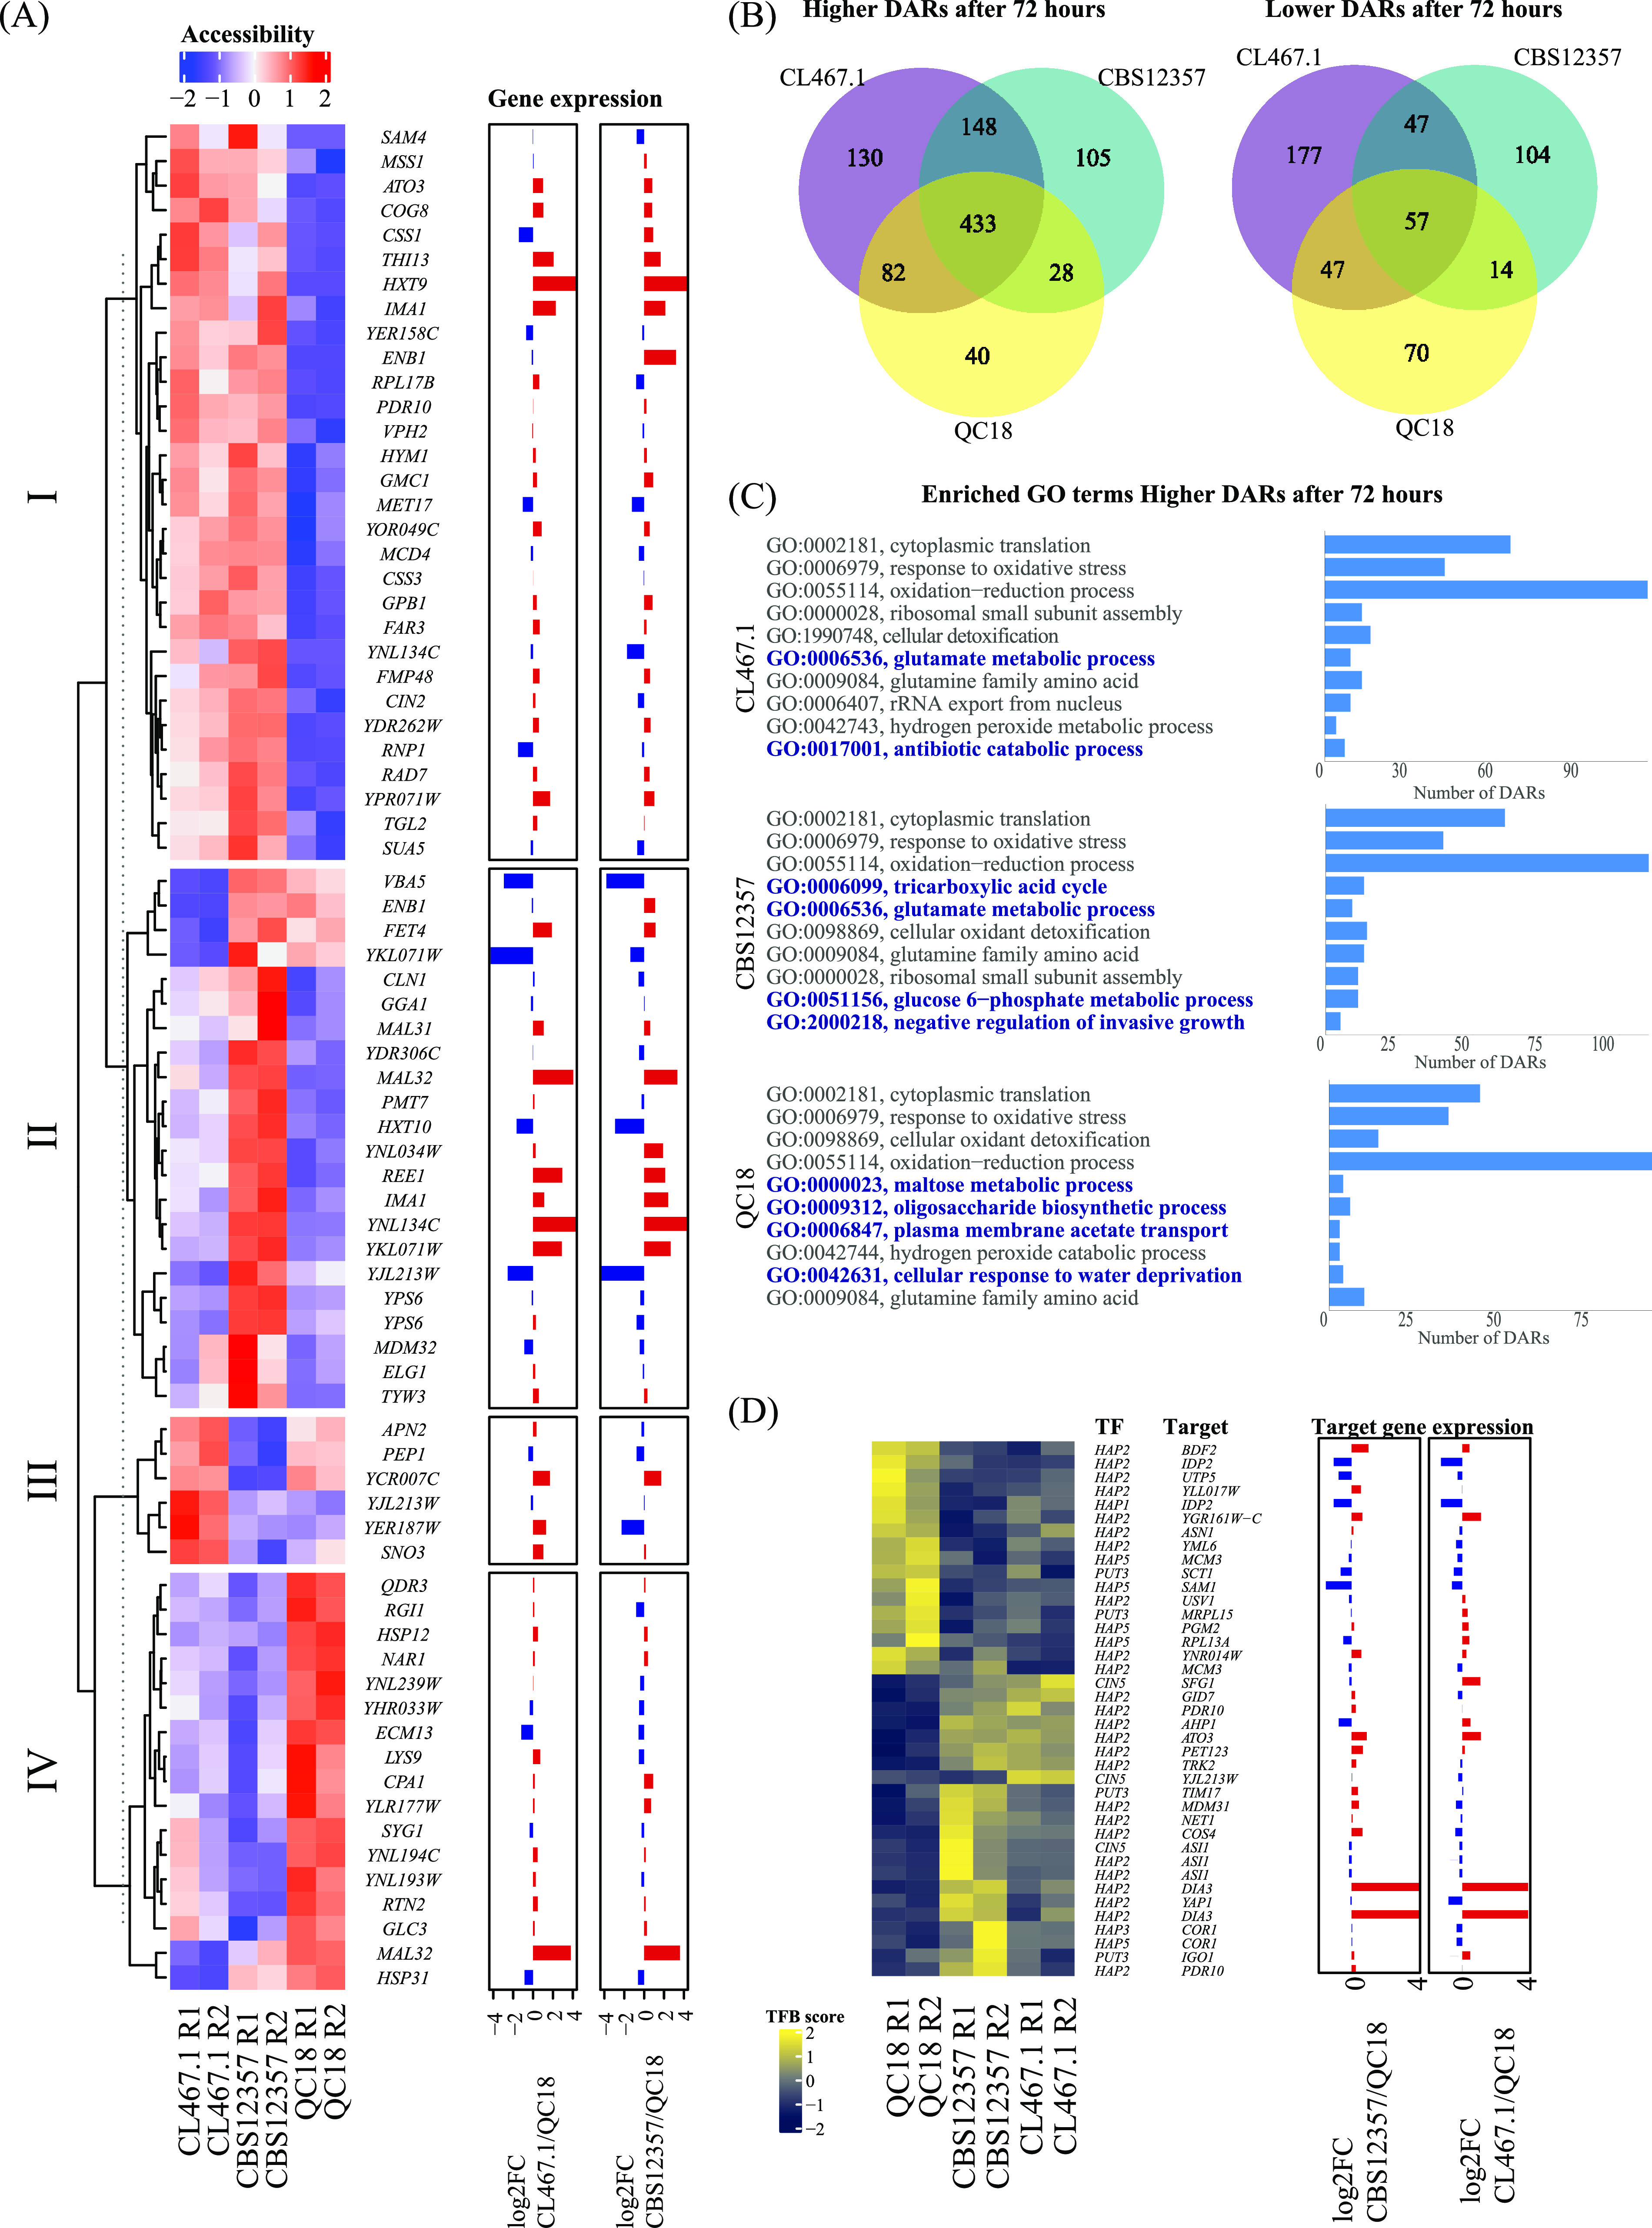
FIG 4.

Differences in chromatin accessibility and transcription factor binding between HF and LF strains. (A) The heatmap shows a hierarchical clustering analysis of chromatin accessibility at promoter regions of HF (CBS12357 and CL467.1) and LF (QC18) strains 20 h after fermentation. Accessibility from ATAC-seq fragments per kilobase per million values was transformed to z-scores and normalized by row. Gene expression at 20 h is shown as log2-fold changes of CL467.1 and CBS12357 relative to QC18. (B) The Venn diagram shows the number of differentially accessible regions (DARs) and their intersection showing higher or lower accessibility in the HF and LF strains in the contrast between 72 and 20 h of fermentation. (C) Gene ontology (GO) enrichment analyses for DARs highlight higher accessibility after 72 h of fermentation. GO terms correspond to Biological Processes. (D) The heatmap shows transcription factor (TF) binding scores obtained from ATAC-seq TF binding footprints transformed to z-scores and normalized by row. Gene expression is shown as in panel A.
