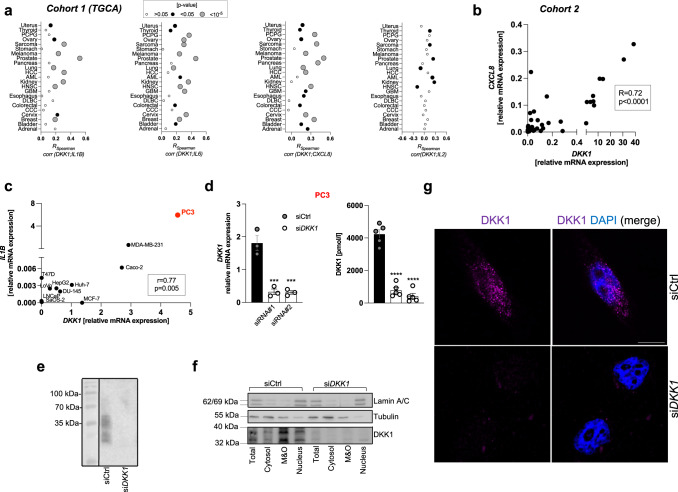
Fig. 1. DKK1 expression associated with inflammation in human cancer.
a Correlations between transcript levels of DKK1 and selected cyto-/chemokines in human tumor tissues visualized as bubble plots. Each dot indicates the Spearman correlation coefficient of the association between DKK1 and cytokine/chemokine expression in the corresponding tissue (see X-axis). The size of the dot corresponds to the respective p value, whereby larger dots reflect smaller (significant) p values. No threshold for statistical significance was predefined. Data were extracted from the Cancer Genome Atlas Project (TGCA) dataset. The following abbreviations are shown: PCPG pheochromocytoma and paraganglioma, HCC hepatocellular carcinoma, AML acute myeloid leukemia, HNSC head and neck squamous cell carcinoma, GBM glioblastoma multiforme, DLBC diffuse large B-cell lymphoma, CCC cholangiocellular carcinoma. b Spearman correlation between DKK1 and CXCL8 (IL8) transcript levels in prostate cancer tissue from an independent cohort of patients. c Correlation between DKK1 and IL1B mRNA expression in human epithelial cancer cell lines determined by qPCR using the ΔΔCT method. PC3 cells exhibiting the highest relative mRNA expression of both molecules are highlighted in red. d DKK1 mRNA (left panel) and protein levels in cell culture supernatants (right panel) 48 h following transfection of PC3 cells with a non-targeting control oligonucleotide (siCtrl) or two independent siRNAs (siRNA#1 and siRNA#2) directed against DKK1 mRNA (siDKK1) (n = 3–5/genotype). e Immunoblot of DKK1 from human cancer cell lysates. Specific bands were detected ranging from approximately 42–24 kDa. f DKK1 protein abundance in subcellular fractions from wildtype and DKK1-deficient cells determined by immunoblot. Representative blots are shown. g Immunofluorescence of DKK1 protein (visualized in magenta) in wildtype and DKK1-deficient PC3 cells. Nuclei are stained by DAPI. The scale bar (in white) shows 10 µM. *p < 0.05; **p < 0.01, ***p < 0.001, ****p < 0.0001. Data were expressed as mean ± SEM. [a, b Spearman correlation, c Pearson correlation, d one-way ANOVA with Holm–Sidak’s post hoc test].

