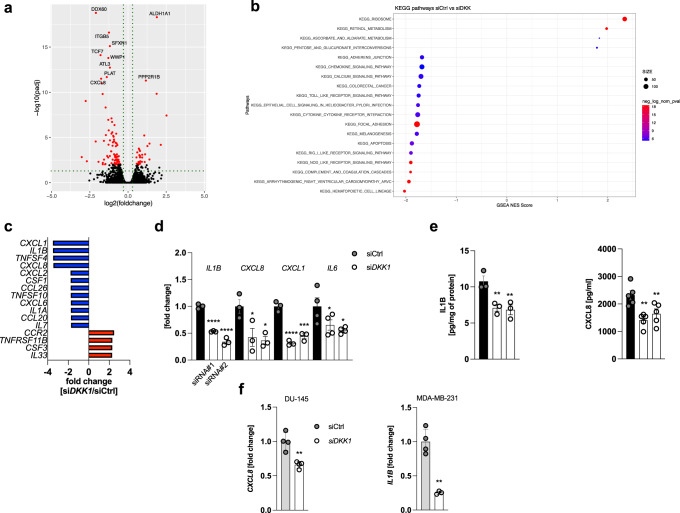
Fig. 2. Suppression of DKK1 production curtails inflammatory cytokine expression in cancer cells.
a Differential expression analysis of RNAseq data from DKK1-deficient and wild-type PC3 cells (siDKK1 and siCtrl, respectively) visualized as a volcano plot. Significantly differentially expressed genes are highlighted in red (n = 3/genotype). b Results from Gene Set Enrichment Analysis (GSEA) visualized as a bubble plot. c Pro-inflammatory cytokine and chemokine PCR array from DKK1-deficient (siDKK1) and DKK1-competent (siCtrl) PC3 cells. The most differentially regulated transcripts are shown (mean of n = 3/genotype is shown). d Quantification of selected cyto-/chemokines by qPCR analysis in DKK1-deficient and -competent PC3 cells. Results for two independent DKK1-targeting siRNAs are shown (referred to as siDKK1#1 and siDKK1#2 and visualized as two separate bars across all figures) (n = 3/genotype). e IL1B and CXCL8 protein levels in total cell lysates and cell culture supernatants from PC3 cells with or without DKK1 knockdown. IL1B remained undetectable in cell culture supernatants (n = 3–5/genotype). f CXCL8 and IL1B mRNA expression in DU-145 prostate and MD-MB-231 breast cancer cells 48 h following siRNA-mediated DKK1 knockdown determined by qPCR. CXCL8 was chosen as a read-out in the former cells as IL1B expression was barely detectable (n = 4/genotype) *p < 0.05; **p < 0.01, ***p < 0.001, ****p < 0.0001. Data were expressed as mean ± SEM. [d, e: one-way ANOVA with Holm–Sidak’s post hoc test, f two-tailed, unpaired student’s t-test].

