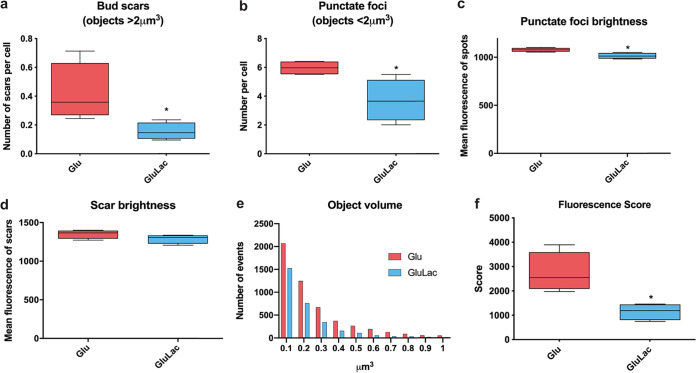
FIG 1.
Regulation of β-1,3-glucan exposure at punctate foci and bud scars. Quantitative fluorescence microscopy was used to examine the impact of lactate on the exposure of β-1,3-glucan at punctate foci and bud scars. C. albicans SC5314 cells were grown in GYNB (Glu; red) or GYNB containing lactate (GluLac; blue), fixed, and stained with Fc-dectin-1. These cells were examined using a Nikon Eclipse Ti UltraVIEW VoX spinning-disk microscope, and the volume and intensity of β-1,3-glucan-exposing features were quantified with Volocity software: septal junctions and bud scars, >2 μm3; punctate foci, <2 μm3. (a) Distribution of β-1,3-glucan-exposing bud scars. (b) Number of β-1,3-glucan-exposing punctate foci showing volumes smaller than 2 μm3 per cell. (c) Mean fluorescence intensity of these punctate foci (brightness). (d) Mean fluorescence intensity of these bud scars (brightness). (e) Object volume showing the number of the events observed. (f) Fluorescence scores for cells grown in GYNB or GYNB containing lactate. This fluorescence score combines the number, volume, and brightness of all β-1,3-glucan-exposing features per cell. Means and standard deviations are for data from four independent experiments, in which a total of approximately 850 cells were analyzed for each condition. The data were analyzed using an unpaired t test (*, P < 0.05).

