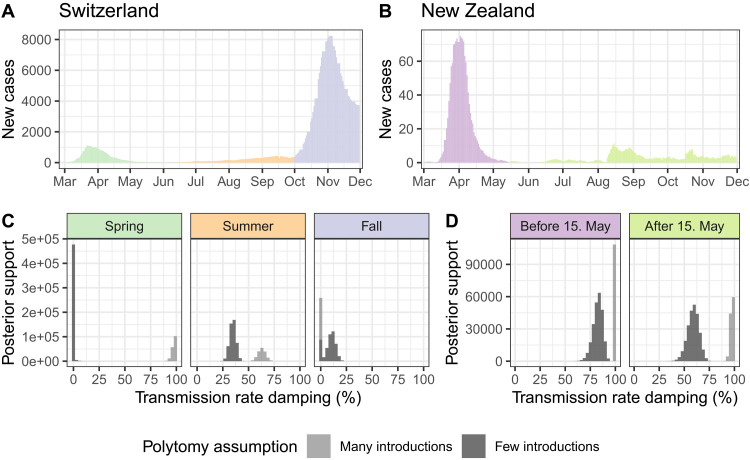
Fig. 3. Phylodynamic estimates for the transmission damping factor in Switzerland and New Zealand compared to case numbers.
Case numbers in (A) Switzerland and (B) New Zealand during 2020 are shown as a 7-day rolling average of daily new confirmed cases (22). (C) and (D) show estimates for if and how much transmission rates were dampened after introductions were sampled during different time periods in (C) Switzerland and (D) New Zealand. The inference was done twice, once conditioning on introductions identified assuming many introductions (light gray) and once assuming few introductions (dark gray). Thus, the difference between estimates in light and dark gray are due to phylogenetic uncertainty. Results shown are from the model with an unbounded sampling proportion prior, results with a bounded sampling proportion prior are similar (Figure S8).

