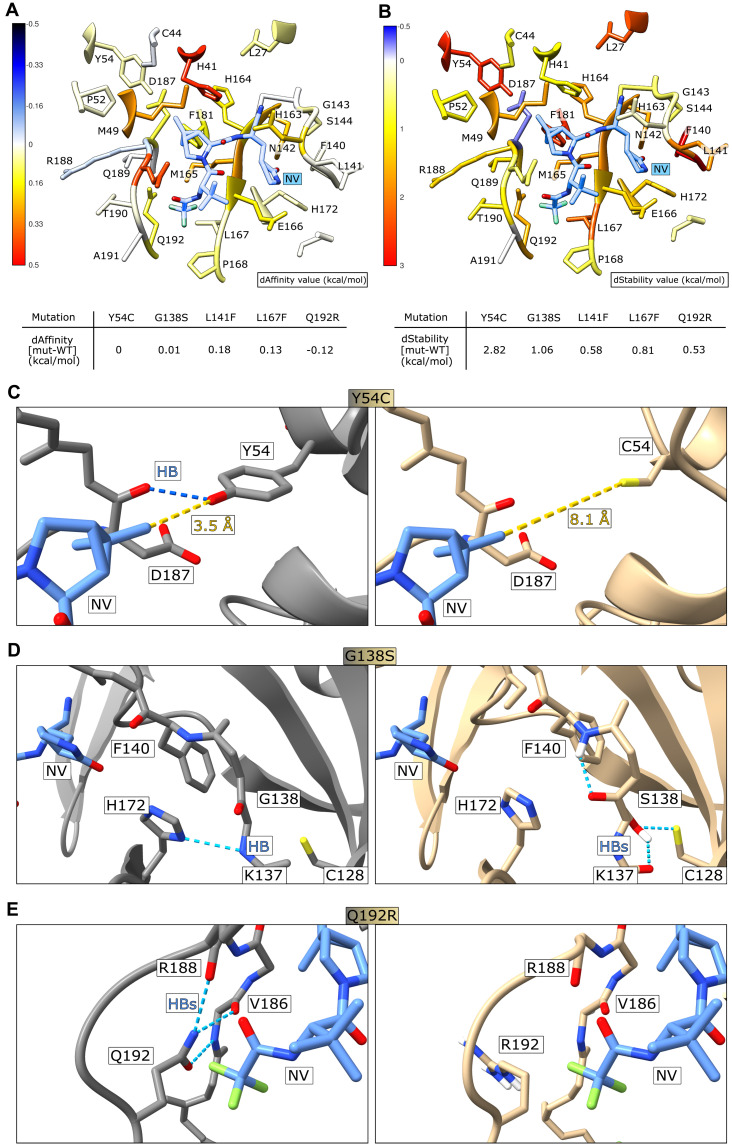
Fig. 7. Structural modelling of mutant 3CLpro variants.
(A) Colorimetric mapping of the dAffinity value (kcal/mol) by virtual alanine scanning with MOE suite. Residues within 5 Å of the nirmatrelvir position are displayed. Colors range from blue (negative values, indicating increased protein-ligand affinity) to red (positive values, indicating decreased protein-ligand affinity). The nirmatrelvir (NV) structure is shown in light blue. (B) Colorimetric mapping of the dStability value (kcal/mol), computed as above for (A). Colors range from blue (negative values, indicating increased in the protein stability) to red (positive values, indicating decreased protein stability. (C) The catalytic center of 3CLpro from PDB structure 7vh8 is shown with nirmatrelvir bound. Y54 (left) forms a strong hydrogen bond (HB, highlighted with a blue dashed line) with D187, whereas nirmatrelvir is at a distance of 3.5 Å (yellow dashed line). The exchange of Y54 with C (right) leads to a loss of the hydrogen bond to D187 and makes room in the nirmatrelvir binding pocket due to the smaller side-chain of cysteine versus tyrosine. (D) G138 (left) contacts H172 with a hydrogen bond. S138 (right) forms several new hydrogen bonds with the backbone hydrogen of F140, backbone oxygen of K137 and the sulfur of C128. (E) Q192 (left) forms hydrogen bonds with the oxygen and nitrogen of V186, the oxygen of R188, and stabilizes the polar contact to the CF3 group of nirmatrelvir. R192 (right) disrupts this hydrogen bond network; subsequent rearrangement could form additional interactions with the CF3 group.

