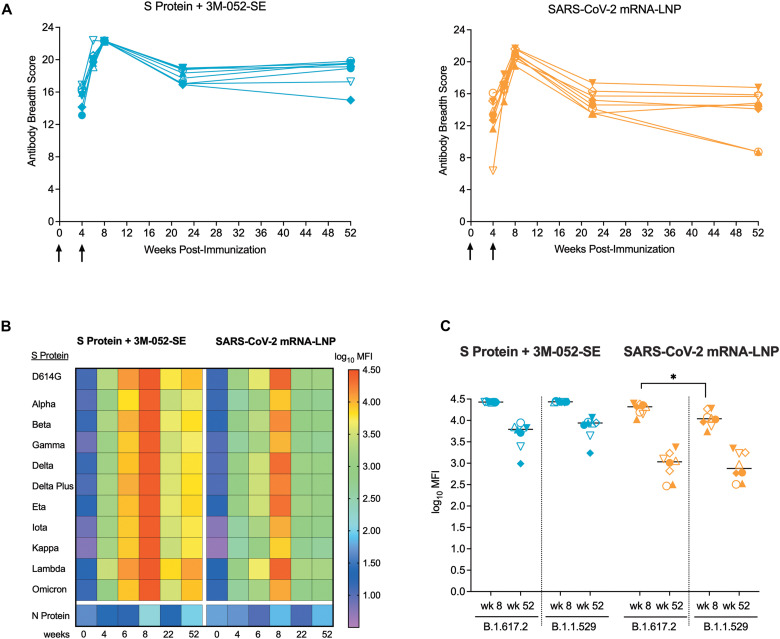
Fig. 3. SARS-CoV-2 vaccination resulted in increased breadth of the plasma antibody response.
(A)Each line represents the longitudinal measurements of the plasma IgG breadth scores of individual RMs in the Protein+3 M-052-SE (left graph) or mRNA-LNP (right graph) group. Arrows indicate time of vaccination. (B) The heatmap shows the median antibody binding as the log10 median fluorescence intensity (MFI) to 11 different S proteins over time in RMs vaccinated with the Protein or mRNA vaccine. Each row represents the antibody binding log10 MFI against one specific S protein (see legend for color code) and each column represents a specific week post-immunization. Antibody binding to the SARS-CoV-2 nucleoprotein (N protein) was negative at all time points. (C) Shown is a comparison of plasma antibody binding to the S proteins of the B.1.617.2 (Delta) and B.1.1.529 (Omicron) variants at peak response (wk 8) and at the time of challenge (wk 52) in RMs of the Protein and mRNA vaccine group. Horizontal lines represent group medians, each symbol represents an individual animal (table S1) with n = 8 RMs per group. Differences in antibody binding to the two distinct S proteins within each group at the same time point were determined by Mann-Whitney test with *p < 0.05.

