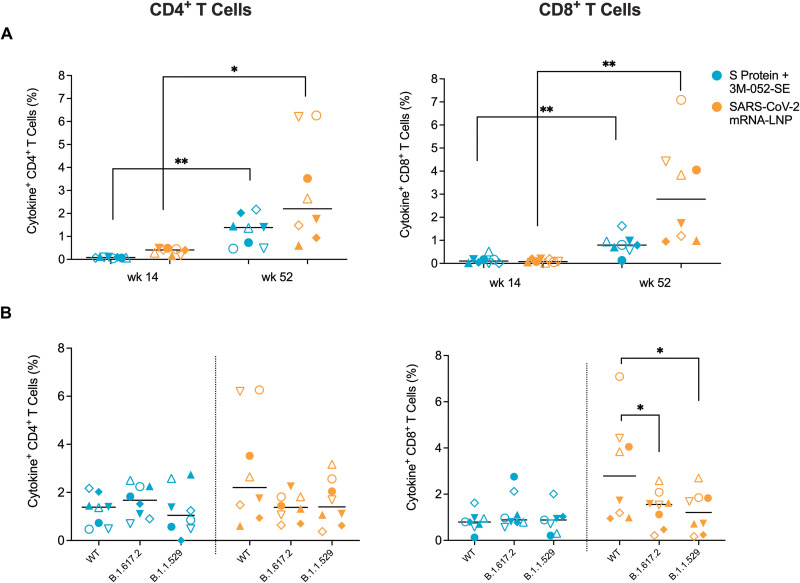
Fig. 5. Vaccination elicits peripheral blood T cell responses in infant RMs.
Peripheral blood CD4+ and CD8+ T cell responses were assessed after in vitro stimulation of PBMCs with a peptide pool spanning the wildtype, B.1.617.2 (Delta), or B.1.1.529 (Omicron) S protein and measuring the percentage of interleukin (IL)-2, interferon (IFN)-γ, IL-17, and tumor necrosis factor (TNF)-α producing CD4+ and CD8+ T cells by flow cytometry. The data represent the sum of all single, double, or triple cytokine positive CD4+ or CD8+ T cells as determined by Boolean gating. (A) CD4+ or CD8+ T cell responses to the WT protein at week 52 were compared to the previously published data of week 14 to illustrate the increase in T cell responses over time in both vaccine groups. (B) The magnitude of CD4+ or CD8+ T cell responses against the Delta or Omicron S proteins are shown in comparison to the WT at the time of challenge (week 52). Horizontal bars indicate medians, each symbol represents an individual RM as outlined in table S1 with n = 8 RMs per group. Differences between RMs of the same group at different timepoints were determined by Wilcoxon rank test with *p < 0.05 and **p < 0.01.

