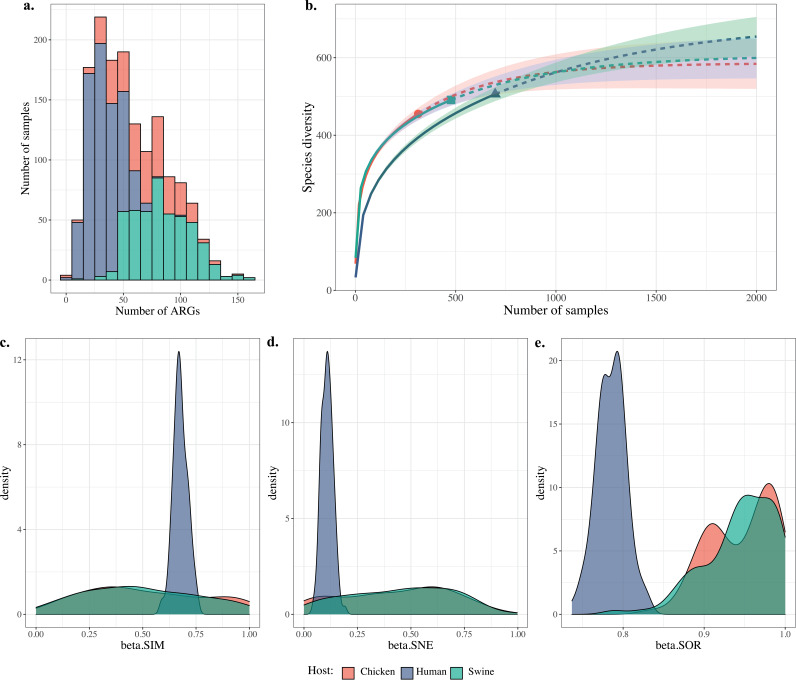
FIG 1.
Diversity comparison of acquired ARGs in the hosts human, chicken, and swine. (a) The frequency distribution of ARGs in all samples; x axis shows bins with 10. (b) Rarefaction curve of the numbers of ARGs interpolated and extrapolated for both types of hosts that are calculated by iNEXT and plotted using R. (c to e) Distribution of 3 Sørensen-based multiple-site dissimilarities accounting for the spatial turnover and the nestedness components of beta diversity, and the sum of both values for ARGs in both types of hosts were calculated using R package betapart with 100 resample times for 10 samples. beta.SIM, value of the overall beta diversity, measured as Sorensen dissimilarity; beta.SOR, value of the turnover component, measured as Simpson dissimilarity; beta.SNE, value of the nestedness component, measured as nestedness-resultant fraction of Sorensen dissimilarity. The same color pattern was used for all panels to represent the host type.

