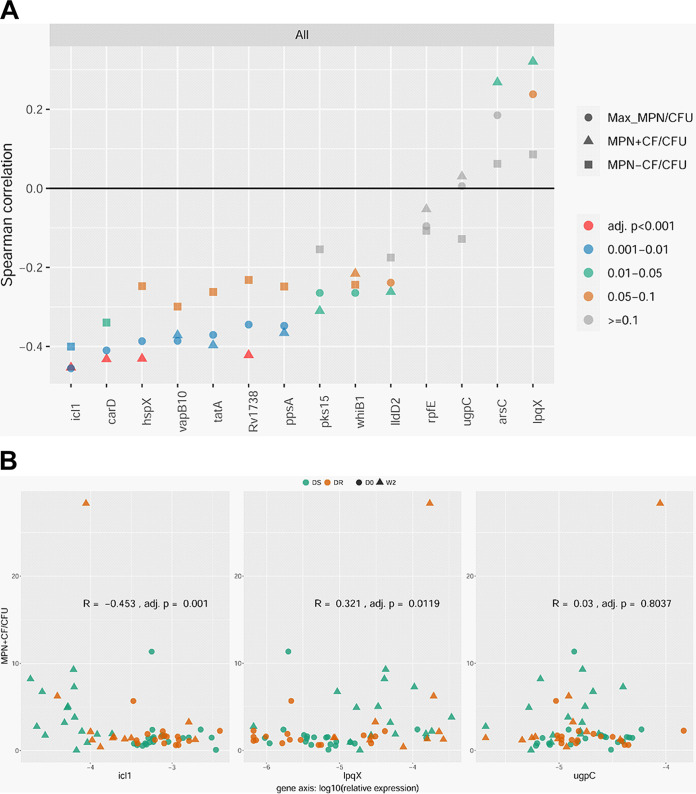
FIG 1.
(A) Summary of Spearman correlation coefficients for the relative expression of the 14 DD M. tuberculosis candidate genes with respect to the relative abundance of DD M. tuberculosis in sputa from patients with drug-sensitive (DS) or drug-resistant (DR) TB before and after initiation of therapy. (B) Representative scatterplots for genes with Spearman correlation coefficients that are negative (icl1), positive (lpqX), or insignificant (ugpC) (as determined by the MPN+CF/CFU ratio). Data are presented for all samples (n = 62 to 63). Complete scatterplots and R and P values can be found in Fig. S3 and Table S3. D0, day 0; W2, week 2; MPN, most probable number; Max MPN, the maximum M. tuberculosis count obtained by MPN with or without CF; CF, culture filtrate.

