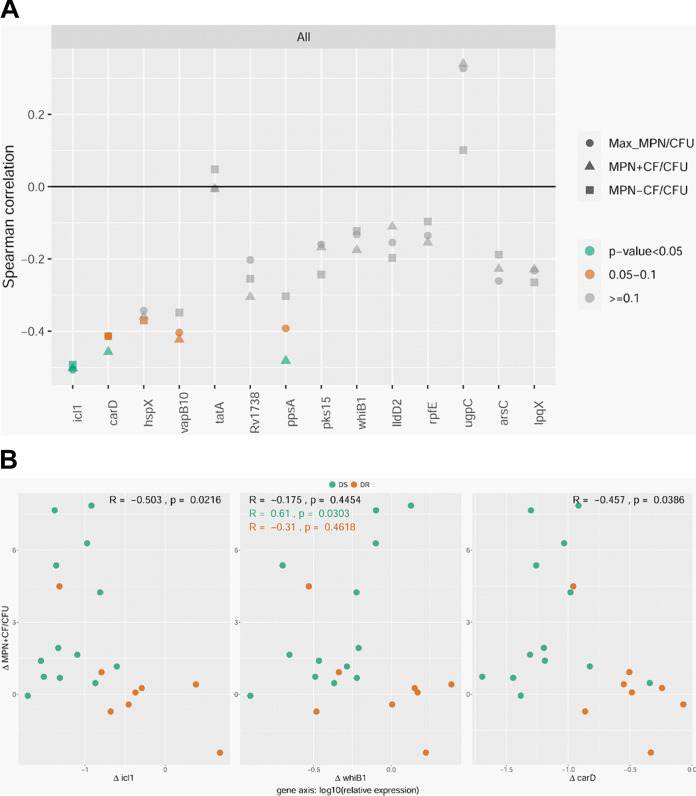
FIG 3.
(A) Summary of Spearman correlation coefficients for the 14 DD M. tuberculosis candidate genes comparing Δ(relative gene expression) versus Δ(DD M. tuberculosis relative abundance) at week 2 versus day 0 for paired sputum samples from both cohorts. (B) Representative scatterplots for genes that show significant Spearman correlation coefficients as determined by the Δ(MPN+CF/CFU) ratio (comparing week 2 versus day 0). All, n = 21 to 22; DS, n = 13; DR, n = 8 to 9. Complete scatterplots and R and P values can be found in Fig. S4 and Table S4. MPN, most probable number; Max MPN, the maximum M. tuberculosis count obtained by MPN with or without CF; CF, culture filtrate.

