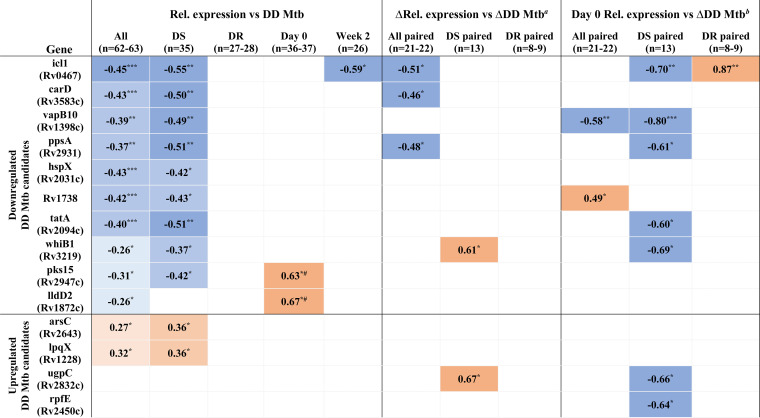
TABLE 3.
Summary of significant Spearman correlation coefficients for the relative expression of the 14 DD M. tuberculosis candidate genes with respect to the relative abundance of DD M. tuberculosis present in patient sputa for the different analyses/subanalyses performed in this studyc
ΔRel. expression versus ΔDD M. tuberculosis comparing week 2 versus day 0 values.
ΔDD M. tuberculosis comparing week 2 versus day 0 values.
Darker shade of blue corresponds to greater negative Spearman correlation coefficient; darker shade of orange corresponds to greater positive Spearman correlation coefficient. The highest Spearman correlation coefficient obtained from MPN+CF/CFU, MPN−CF/CFU, or MPNMax/CFU is presented. Rel, relative. Statistical significance shown as follows: *, P value < 0.05; **, P value < 0.01; ***, P value < 0.002; #, Spearman correlation coefficients reached statistical significance only for the DS cohort, which is presented here.

