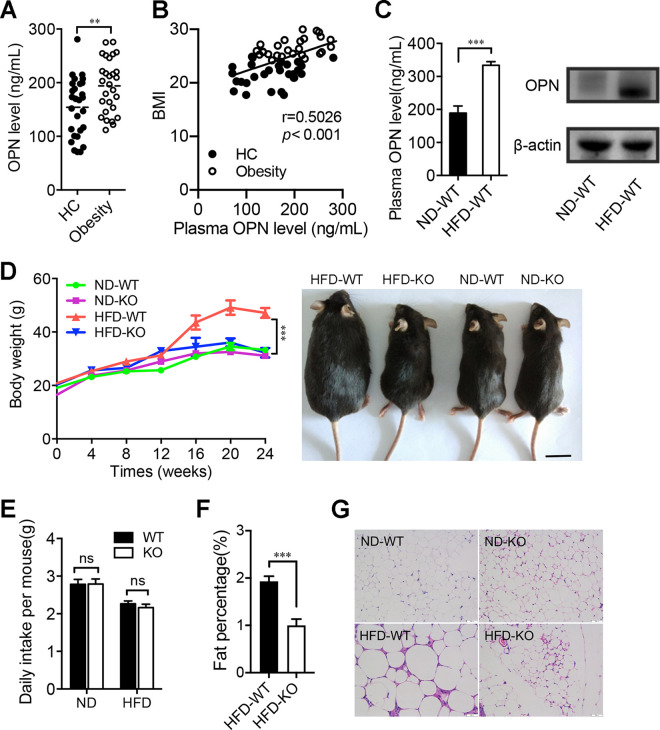
FIG 1.
Osteopontin (OPN) deficiency resisted the high-fat diet (HFD)-induced lipid accumulation. The plasma samples of individuals with obesity (Obesity, n = 28) and nonobese healthy controls (HC, n = 27) were collected. (A) Plasma OPN levels and (B) the correlation of BMI and plasma OPN levels were assessed. Then, wild-type (WT) and OPN knockout (KO) mice were fed with a normal diet (ND) or a high-fat diet for 24 weeks. (C) The plasma and intestinal OPN levels in WT mice were measured after 24-weeks of ND-feeding or HFD-feeding (ND-WT, HFD-WT). (D) Dynamic observation of body weight at week 0 to 24 and the representative image of mice at week 24 in ND-fed or HFD-fed WT and KO mice (ND-WT, ND-KO, HFD-WT, HFD-KO). (E) Comparison of daily diet intake per mouse among the four groups of ND-WT, ND-KO, HFD-WT and HFD-KO mice. (F) Fat percentage (%) in HFD-WT and HFD-KO mice. (G) Representative histological images of hematoxylin-eosin (HE) staining on adipose tissues in mice (ND-WT, ND-KO, HFD-WT, HFD-KO). Data are given as the means ± the standard errors of the mean (SEMs). A Student’s t test (panels A, C, and F), the Spearman’s rank correlation (panel B), and a two-way analysis of variance (ANOVA) (panels D and E) were used to analyze the data with n = 8 to 12 per group, **, P < 0.01; ***, P < 0.001.

