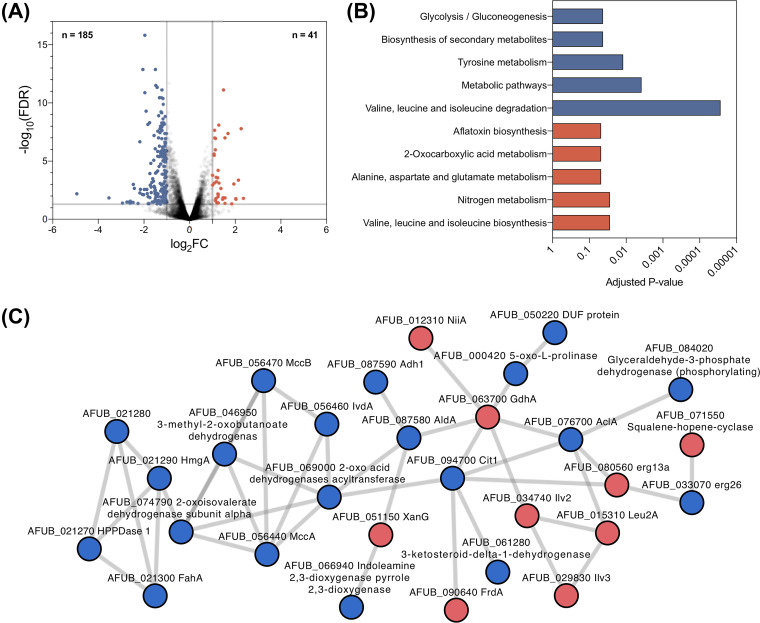
FIG 4.
Transcriptomics of MFIG001 to olorofim. (A) Volcano plot of RNA-seq of A. fumigatus MFIG001 exposed to olorofim. In total, 185 genes (blue dots) and 41 genes (red dots) were considered downregulated and upregulated, respectively (>2-fold differentially regulated; P < 0.05). (B) KEGG pathways were enriched within differentially regulated genes, blue categories denote those associated with downregulated genes, and red denotes those with upregulated genes. (C) Interactions of proteins involved in response to olorofim as determined by StringsDB. Proteins derived from upregulated transcripts are in red and downregulated in blue.

