FIG 4.
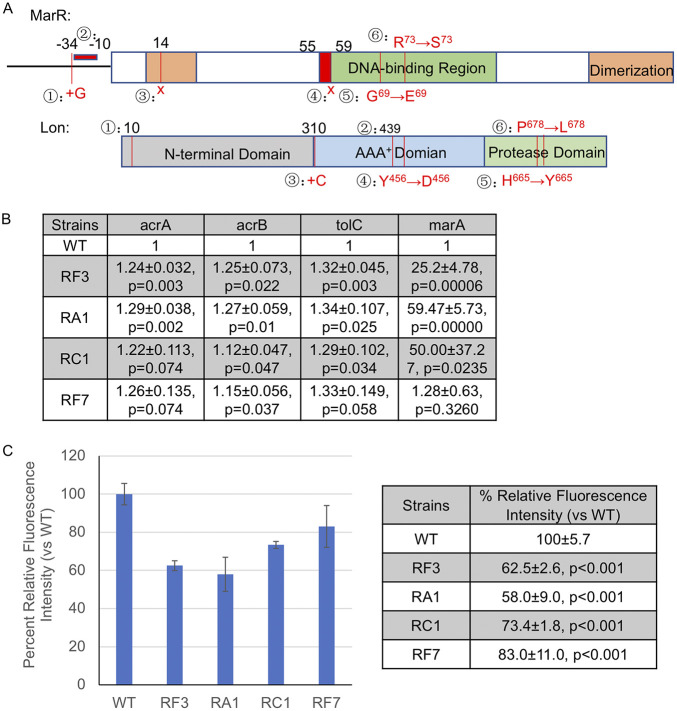
Mutants broadly resistant to antidepressants and antibiotics have increased expression in acrA, acrB, and tolC genes and display greater efflux activity. (A) Location and description of mutations in marR and lon identified in resistant (RA, RC, RF) mutants. (mutations in MarR) The boxed area represents the coding sequence (144 amino acids) and the black line to the left represents the upstream regulatory promoter region. Green shading represents the DNA-binding region of MarR (aa 55 to 100). Brown shading represents the regions involved in MarR dimerization (aa 10 to 22 and 123 to 144). Numerated are the mutations identified in resistant strains: ① Insertion of a G in the 34 nt upstream of marR; ② 20 nt deletion upstream of marR ORF starting at −10; ③ Nonsense mutation L14* (TTG→TAG); ④ Nonsense mutation E59* (GAA→TAA); ⑤ G69E (CCT→CTT); ⑥ R73S (CGT→AGT); (mutations in Lon) The boxed area represents the coding sequence (784 amino acids). Gray shading represents sequence for N-terminal (aa 1 to 309). Blue shading represents sequence coding for the AAA+ domain of lon (aa 309 to 585). Green shading represents sequence coding for the protease domain of lon (aa 585 to 784). Numerated are the mutations identified in resistant strains: ① Δ1 bp (29/2355 nt); ② Δ1 bp (1316/2355 nt); ③ +C (931/2355 nt); ④ Y456D (TAC→GAC); ⑤ H665Y (CAC→TAC); ⑥ P678L (CCG→CTG). (B) Levels of acrA, acrB, tolC, and marA mRNAs in resistant mutants versus wild-type cells. Measurements of mRNAs are all normalized to wild-type, values are averages and SEMs analyzed by Student's t test to determine the corresponding P-values. (C) Efflux activity measured as a function of Hoescht 33342 accumulation. Plotted (left) is the mean fluorescence intensity relative to wild-type (set to 100%) at 30 min and error bars represent SEMs. Values of the same measurements in the table (right) and analyzed by Student's t test to determine the corresponding P values. In (B) and (C), four independent biological replicates were performed for each strain.

