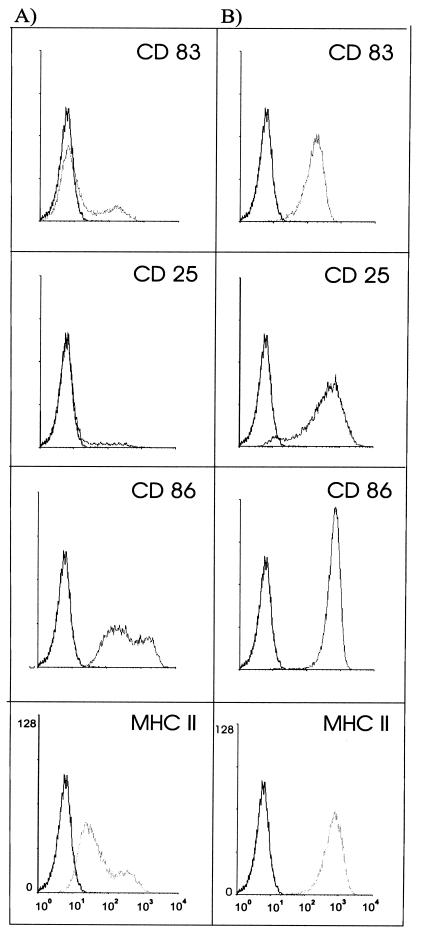
FIG. 6.
Flow cytometry profiles of surface marker expression of CD83, CD25, CD86, and MHC class II on human DCs of either uninfected cells (A) or L. monocytogenes EGD-infected cells (B) (MOI = 50, 16 h p.i.). The y axis of each histogram shows the relative cell number; the x axis shows the log fluorescence intensity. Black histograms represent staining with matched-isotype antibodies.

