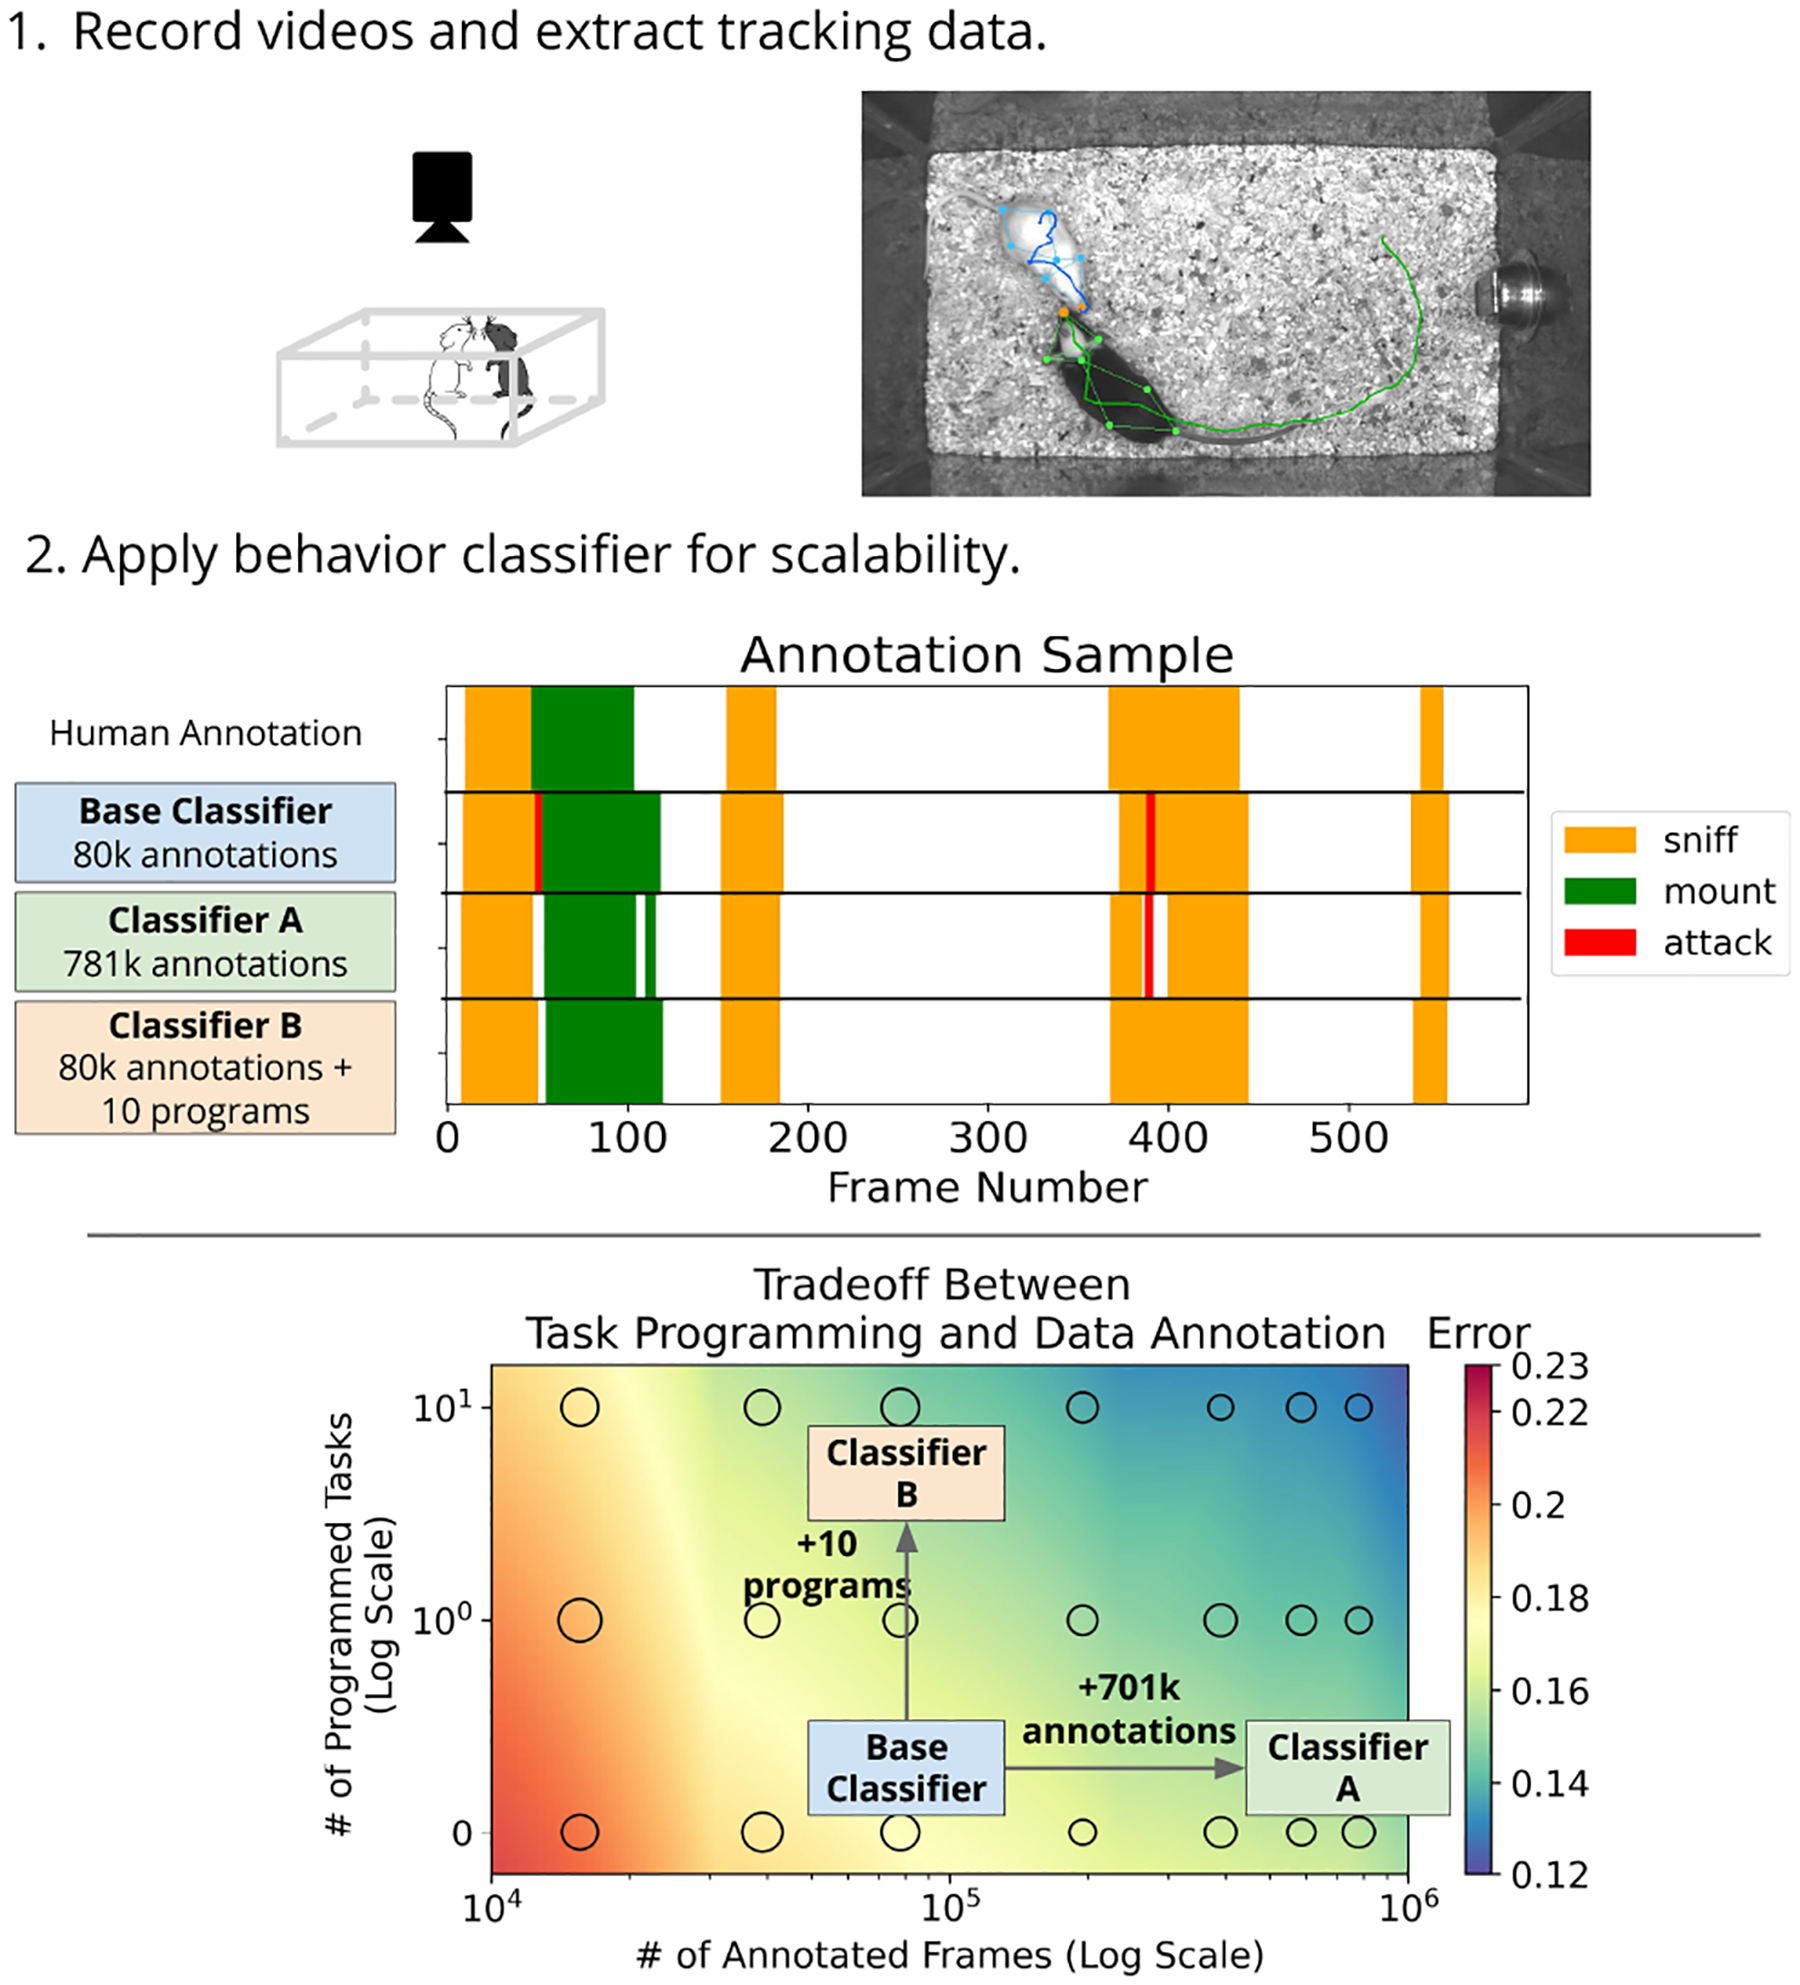
Figure 1. Overview of our approach.

Part 1: A typical behavior study starts with extraction of tracking data from videos. We show 7 keypoints for each mouse, and draw the trajectory of the nose keypoint. Part 2: Domain experts can either do data annotation (Classifier A) or task programming (Classifier B) to reduce classifier error. The middle panel shows annotated frames at 30Hz. Colors in the bottom plot represent interpolated performance based on classifier error at the circular markers (full results in Section 4.3). The size of the marker represents the error variance.
