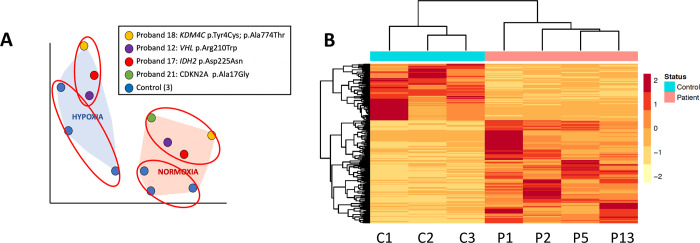
Fig 2. RNA-seq analysis shows differentially expressed genes between proband and control groups.
A. T-SNE shows clusters based on hypoxia treatment and whether the sample is from a proband or a control. B. Heatmap of significant (p<0.05) differentially expressed genes in 4 probands at normoxia vs. 3 controls at normoxia. Proband numbers (P1-P4) correspond to Table 1.

