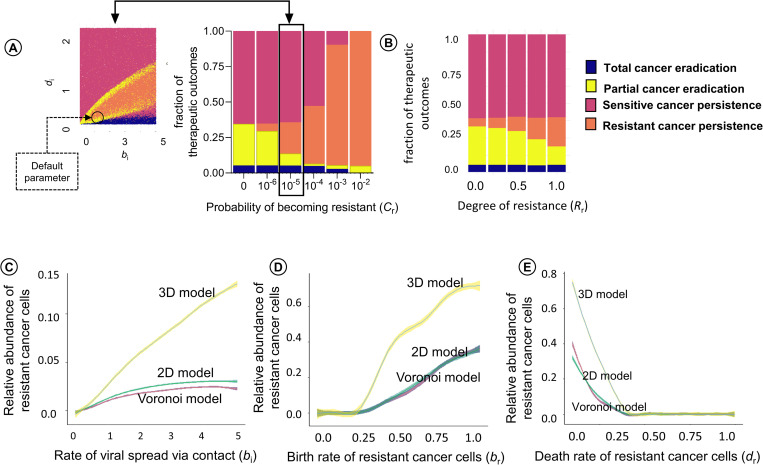
Fig 4. Factors influencing the persistence of resistant cancer cells in the tumour.
(A) Effect of the probability of becoming resistant (Cr) and the degree of resistance (Rr) on the therapeutic outcome in the Voronoi model. For the same range of parameter values as in Fig 3 (rate of viral spread (bi) and death rate (di) of infected cells), 100,000 simulations (for A) and 10,000 simulations (for B) were run and classified as to their therapeutic outcome. The bar chart indicates the likelihood of the four outcomes for six values of Cr and five values of (Rr). For ease of interpretation, the production rate of 10−5 per cell division is highlighted and linked to the Voronoi variant of Fig 3B. The size of the four bars in the bar chart is proportional to the areas indicated by blue, yellow, red, and orange in the panel to the left. Effects of (C) the rate bi of viral spread, (D) the proliferation rate br of infection-resistant cancer cells, and (E) the death rate dr of resistant cancer cells on the frequency of resistant cancer cells at the end of a simulation run. For graphs C to D, 10,000 simulations were run (for 1,000 parameter configurations and 10 replicates per configuration) for each of the three spatial configurations (2D grid, Voronoi, 3D grid), varying the parameter under investigation and keeping all other parameters at their default values (indicated by a black circle in Fig 4A). The coloured lines indicate the mean per parameter value, and the coloured envelopes around the lines correspond to the 95% confidence band.

