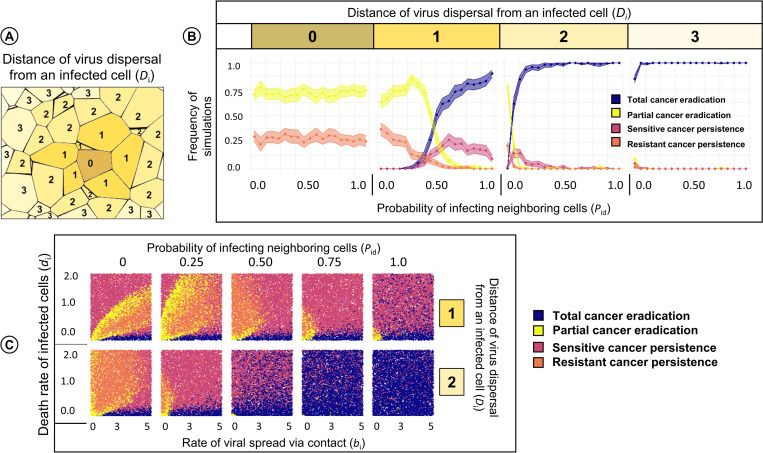
Fig 6. Effect of viral dispersal distance and the probability that neighbouring cells are infected via diffusing viruses on the therapeutic outcome.
In the Voronoi model, we considered various dispersal distances of the virus. For each dispersal distance, we changed the probability Pid that upon the death of an infected cell the cells in the diffusion neighbourhood of that cell are infected, keeping all other parameters at their default values. (A) Interpretation of the viral dispersal distance, here ranging from 0 to 3. A focal cell marked “0” has distance zero to itself, distance one to its neighbours, distance two to its neighbours, etc. (B) Therapeutic outcome for dispersal distances 0, 1, 2, and 3 in relation to the probability Pid of being infected by an infected neighbour. For each graph, 10,000 simulations were run; coloured lines and envelopes indicate the bootstrapped mean simulation outcome and the 95% confidence band. In (C) we changed the Pid and dispersal distance for the same range of parameter values as in Fig 3 (rate of viral spread and death rate of infected cells) and 10,000 simulations were run for each graph. Each simulation outcome is represented by a point, the colour of which indicates the therapeutic outcome.

