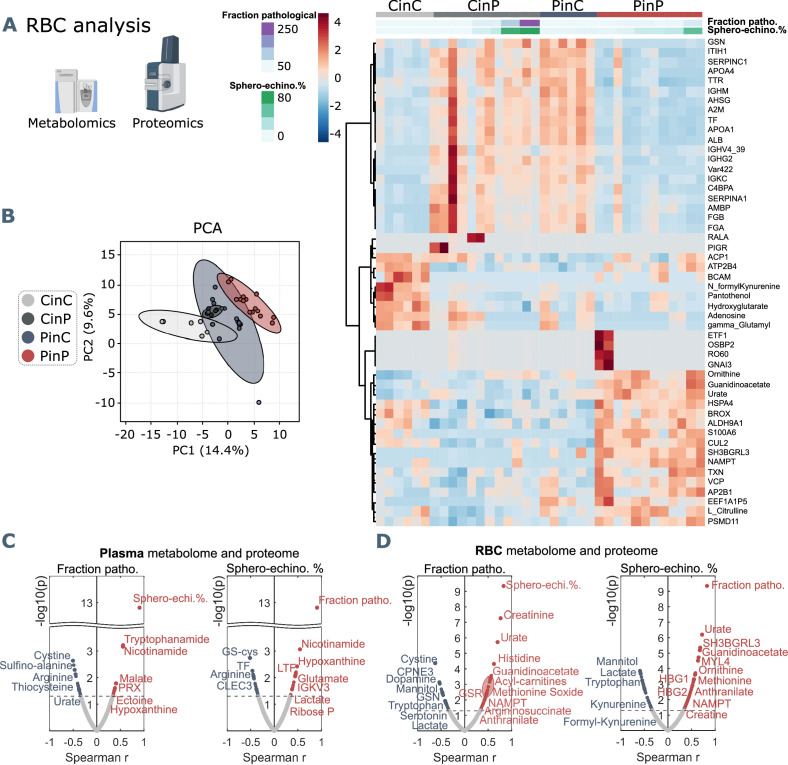
Figure 4. Metabolomics and proteomics analyses on RBCs of the four sample groups and correlation analyses with shape parameters.
(A) Hierarchical clustering analysis of the top 50 metabolites and proteins in RBCs by two-way ANOVA test that exhibited the most pronounced changes. (B) PCA analysis performed on the metabolomics and proteomics from RBC content presented in Figure 3—source data 1 showing clusters of each sample group, where CinC is neighboured by the overlapping clusters CinP and PinC, and PinP as the furthest cluster. Plasma and RBC Spearman correlation analysis of RBC shape parameters with omics data. Volcano plot representations highlight the most significant proteins and metabolites in plasma (C) and in RBCs (D) positively (red) or negatively (blue) correlated to the fraction of pathological RBC shapes (left panels in C and D) or sphero-echinocyte percentage (right panels in C and D). p values are plotted on the y-axis versus magnitude of change (fold change) on the x-axis; significance threshold is set at p<0.05.


