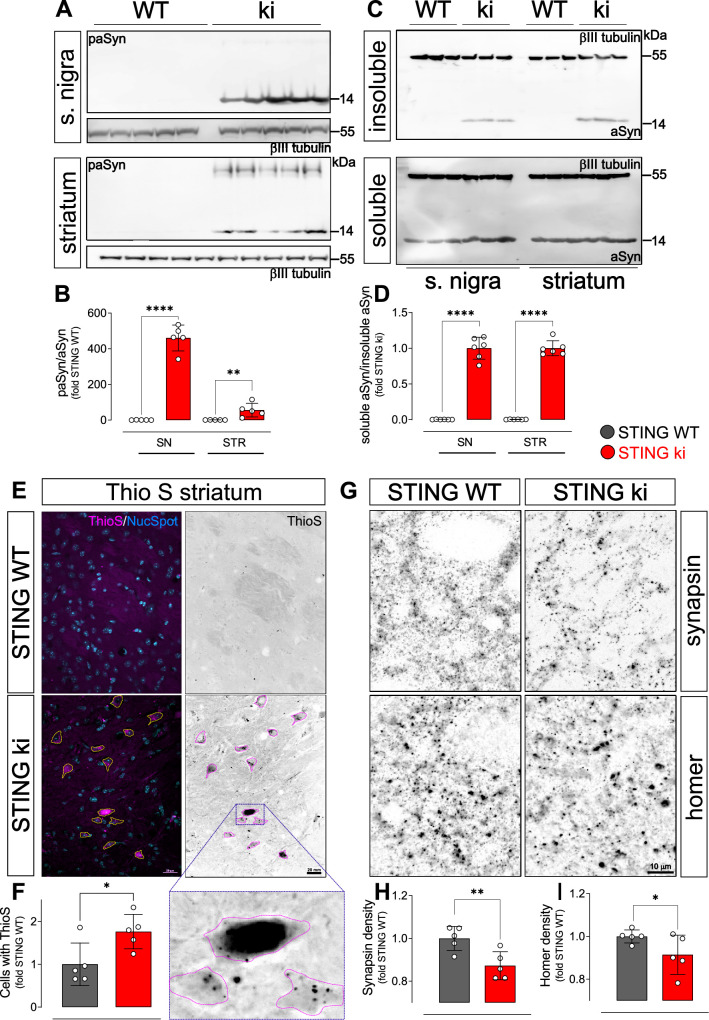
Figure 3. Constitutive STING activation induces alpha-synuclein pathology and synapse loss in adult mice.
(A) Representative western blot images showing phosphorylated alpha-synuclein (S129; paSyn) and the loading control βIII-tubulin detected from the substantia nigra (upper panel) and striatum (lower panel). Total levels of aSyn detected from the same membranes are shown on Figure 3—figure supplement 1A, B. (B) Ratio of paSyn and total aSyn signals, expressed as relative to the mean of STING WT (substantia nigra (SN): p=0.000065; striatum: p=0.019; t-test, n=5). (C) Representative western blot images showing aSyn and βIII-tubulin detected from the Triton X-100 insoluble (upper panel) and soluble (lower panel) fractions prepared from the substantia nigra or from the striatum. (D) Ratio of aSyn signals detected in the Triton X-100 soluble and insoluble fractions, expressed as relative to the mean of STING ki (substantia nigra (SN): p=0.00001; striatum: p<0.00001; t-test, n=6). (E) Representative images of striatal sections from 20-week-old STING WT and STING ki mice stained with Thioflavin S (magenta) and nuclear sdye (blue) on the composite images, and ThioS BW. Scale bar: 20 μm. (F) Number of cells with inclusions positive for Thioflavin S (ThioS) per mm2 (*: p=0.0141; t-test, n=5). (G) Representative images of striatal sections from 20-week-old STING WT and STING ki mice stained for the presynaptic marker synapsin (upper panel) or for the post-synaptic marker homer (lower panel). Scale bar: 10 μm. (H–I) Area fraction positive for synapsin (H, p=0.0053) or homer (I, p=0.0408) (mean ± SD; t-test, n=5).
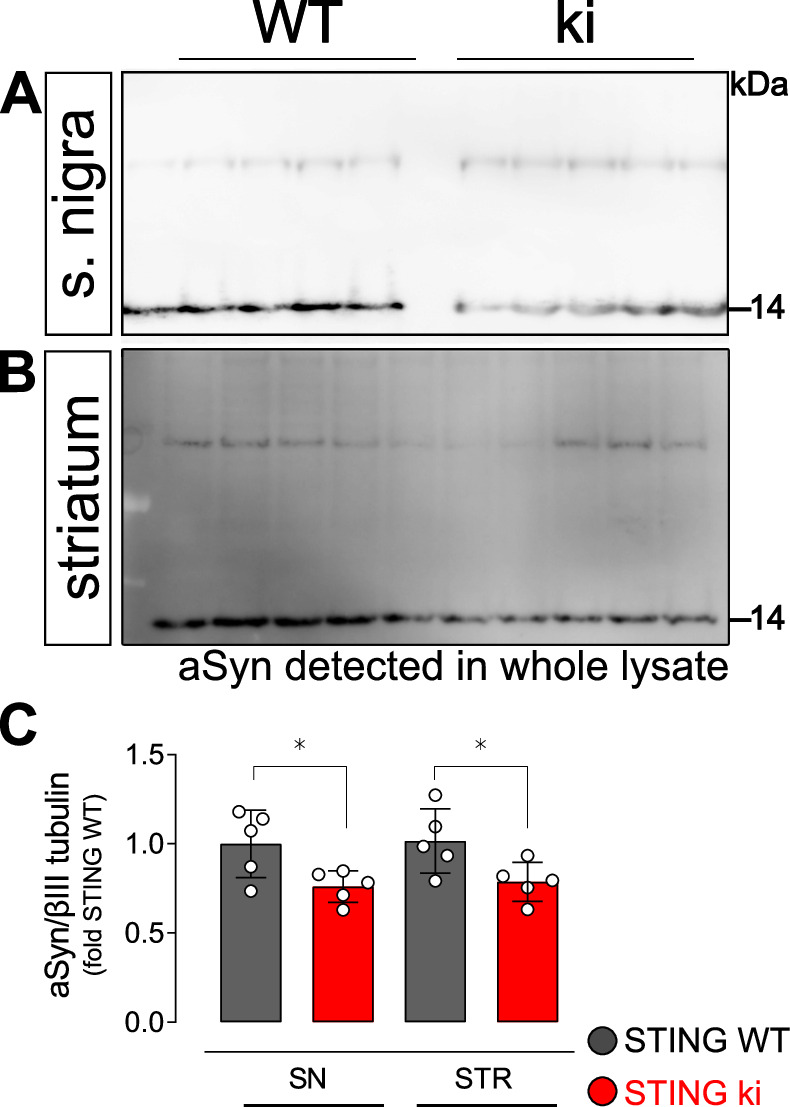
Figure 3—figure supplement 1. Uncropped membranes showing α-Synuclein signal detected from whole cell lysates of striatum and substantia nigra.


