. 2022 Oct 31;11:e81943. doi: 10.7554/eLife.81943

Figure 7. Neuroinflammation in adult double transgenic mice with STING ki and knock-out for Ifnar1 or Caspase-1.

(A) Heatmap showing z-scores of different inflammatory markers in double transgenic mice with STING N153S/WT ki and knock-out for Ifnar1 or Caspase-1. Graphs with data for each mediator individually are on (Figure 7—figure supplement 2). (B) Representative images of striatal sections stained for the microglia marker Iba1. Sections were obtained from adult STING WT (upper images) or STING ki (lower images) mice on a background of interferon a receptor knockout (Ifnar1-/-), caspase-1 knockout (Casp1-/-) or Ifnar1+/+, Casp1+/+ (Ctrl.). Scale bar: 50 μm. (C) Representative images of striatal sections stained for the astroglia marker GFAP from STING WT (upper images) or STING ki (lower images) mice on a background of interferon a receptor knockout (Ifnar1-/-), caspase-1 knockout (Casp1-/-) or Ifnar1+/+, Casp1+/+ (Ctrl.). Scale bar: 50 μm. (D) Area fraction positive for Iba1, normalized to the mean of STING WT brains (differences in +/+ mice ***: p=0.0000001; for Ifnar1-/- ***: p=0.000003; for Casp1-/- ***: p=0.0029374; two-way ANOVA with Bonferroni post-hoc test, n=5–6). (E) Area fraction positive for GFAP, normalized to STING WT on Ctrl. Background (***: p=0.0000 for STING WT vs STING ki on Ctrl.; ***: p=0.0000 on Ifnar1-/-; background, ***: p=0.0006 on Casp1-/- background; two-way ANOVA with Bonferroni post-hoc test, n=5–6).

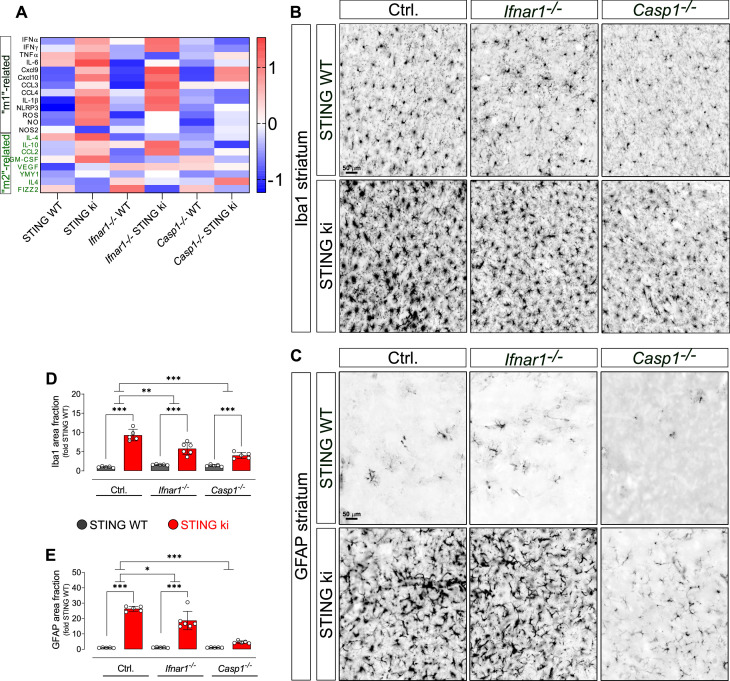
Figure 7.

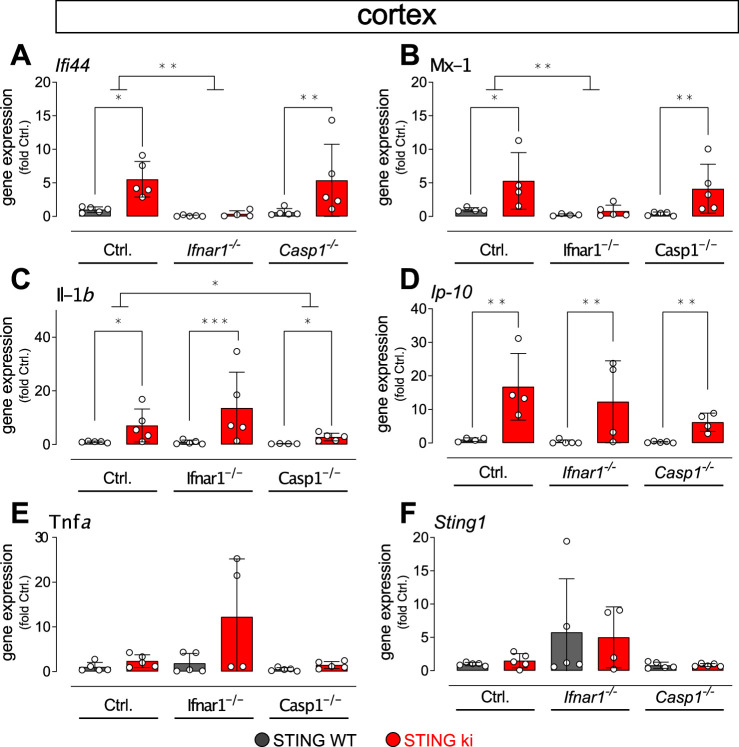
Figure 7—figure supplement 1. Expression of IFN- and NF-κB/inflammasome related genes in the cortex of double transgenic mice with STING N153S/WT ki and knock-out for Ifnar1 or Caspase-1.

Figure 7—figure supplement 1.

Gene expression in the cortex (two-way ANOVA with Tukey HSD post-hoc test). (A) Ifi44 (*: p=0.01414; **: p=0.0037655; for interaction between Ctrl. and Ifnar1-/-, **: p=0.005101, n=4–5). (B) Mx1 (*: p=0.02823; **: p=0.00573, n=4–5). (C) Il1b (Ctrl. background *: p=0.04534; **: p=0.005405; Casp1-/- background *: p=0.0107096; for interaction between Ctrl. and Casp1-/-, *: p=0.01298, n=4–5). (D) Cxcl10 (Ctrl. background **: p=0.0030844; Ifnar1-/- background: p=0.025893; Casp1-/- background **: p=0.0041598, n=4–5). (E) Tnfa (all differences n.s., n=4–5). (F) Sting1 (all differences n.s., n=4–5).
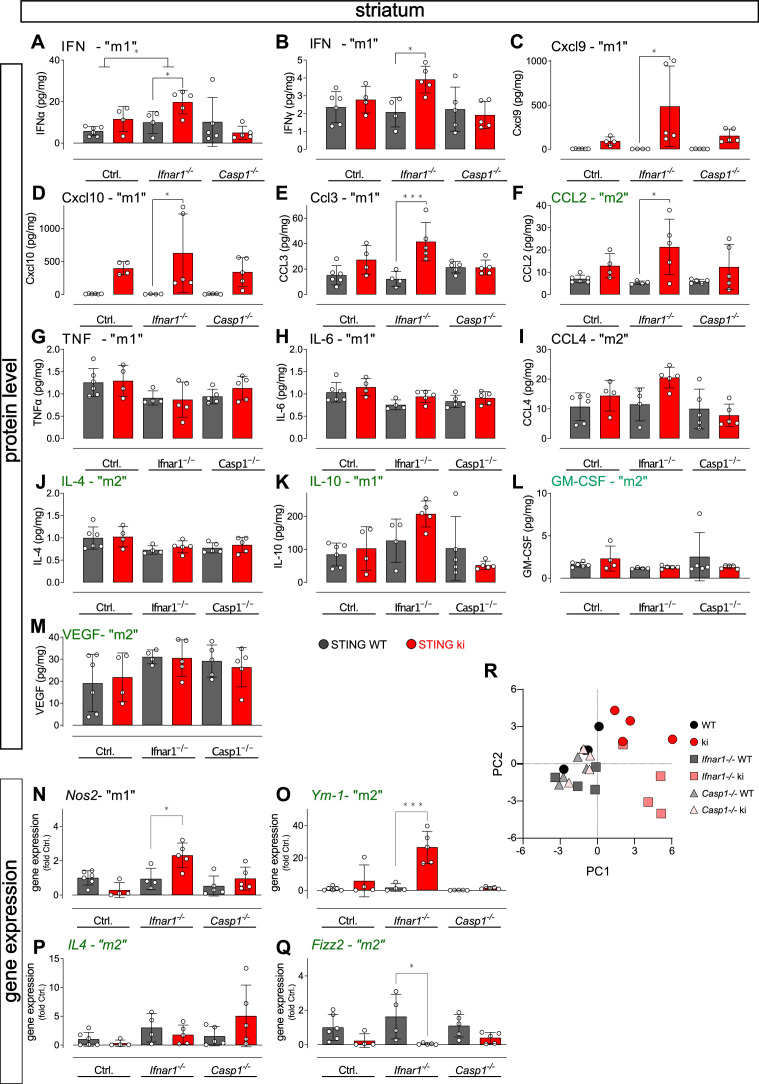
Figure 7—figure supplement 2. Levels of inflammatory mediators and gene expression in the striatum of double transgenic mice with STING N153S/WT ki and knock-out for Ifnar1 or Caspase-1.

Figure 7—figure supplement 2.

(A–M) Tissue levels of different ‘M1’ and ‘M2’ mediators in the striatum as measured by LegendPlex Immunoassay (ANOVA with Tukey HSD post-hoc test). (A) IFNα (*: p=0.0394; for interaction: *: p=0.0465); (B) IFNγ (*: p=0.0194); (C) Cxcl9 (*: p=0.0129); (D) Cxcl10 (*: p=0.0223); (E) CCL3 (***: p=0.0009); (F) CCL2 (*: p=0.0264); (G) TNFα; (H) IL-6; (I) CCL4; (J) Il4; (K) IL-10; (L) GM-CSF; (M) VEGF; (N–Q) Gene expression in the striatum (two-way ANOVA with Tukey HSD post-hoc test). (N) Nos2 (*: p=0.0214). (O) Ym-1 (***: p=0.0004). (P) Il4. (Q) Retnla, b or g (p=0.021). (R) Principal component analysis (PCA) of immune mediators shows segregation of STING ki animals on the Ifnar1+/+, Casp1+/+ (ki) and on the Ifnar1-/- (Ifnar1-/- ki) from all other groups. n=4–6.