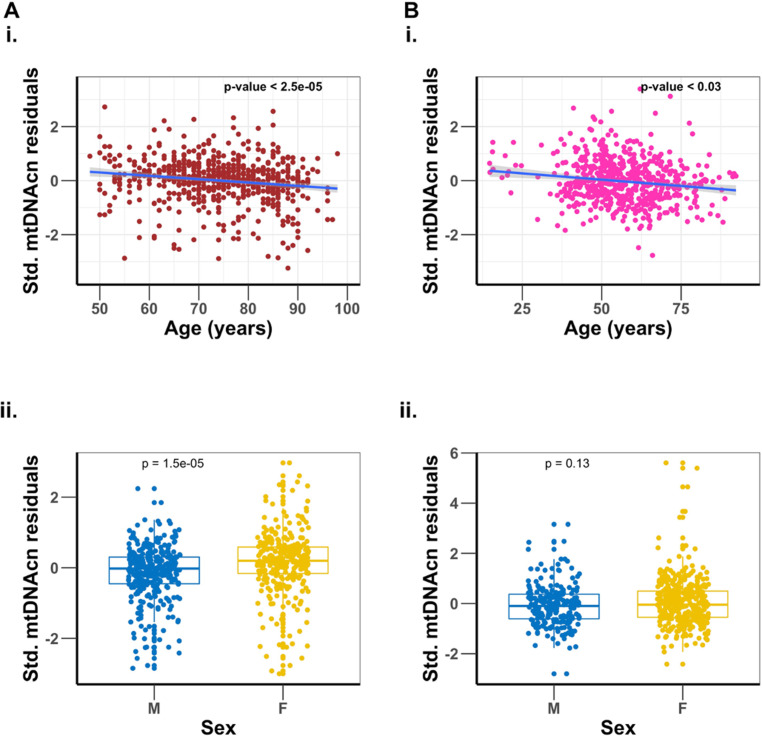
Figure 1. Association of mitochondrial DNA copy number (mtDNAcn) with age, and sex differences.
Panel (A) is the Baltimore Longitudinal Study of Aging (BLSA) cohort, and panel (B) is the SardiNIA cohort. Plots (i) are regression of mtDNAcn residuals on age after adjusting for sex, sequence coverage, platelets count, and white blood cell parameters. Plots (ii) are comparisons of mtDNAcn residuals after adjusting for age, sequence coverage, platelets count, and white blood cell parameters between males (M) and females (F), with t-test p-values shown.

