Figure 3. EROS interacts and colocalises with the oligosaccharyltransferase (OST) complex.
(A) EROS-FLAG affinity purification-mass spectrometry (AP-MS). Graph showing abundance (average number of peptide spectrum matches across four biological replicates) of all proteins identified in the FLAG AP-MS experiments (blue and red dots) versus their interactor specificity (SAINT probability score: SP). The red line marks the SP score cut-off (0.9) for high-confidence interacting proteins. Proteins (dots) above this cut-off (59) are deemed high-confidence interactors. The bait (EROS) and interacting proteins relevant to this study are shown in red. (B) Protein interaction network of the 59 high-confidence EROS-interacting proteins (SP >0.9). The protein interactions were derived from STRING. Coloured nodes represent proteins annotated with enriched Gene Ontology (GO) terms relevant to this study. (C, D) EROS and gp91phox localization, following fixation and labelling with anti-EROS antibody, in HEK293 cells expressing STT3A-GFP and EROS constructs (C) or STT3A-GFP, gp91phox-mRFP and EROS untagged constructs (D); scale bars = 5 μm. Graphs represent the intensity profile of STT3A-GFP and EROS signal or STT3A-GFP, gp91phox-mRFP, and EROS signal measured across the nuclear membrane (indicated in red line). (E) Expression of gp91phox in HEK293 cells transfected with the indicated constructs and treated with OST inhibitor (NGI-1) at the indicated concentration. (F) Expression of gp91phox in control and STT3A-/- or STT3B-/- HEK293 cells transfected with the indicated vectors. (G) Expression of gp91phox in PLB985 cell line treated with NGI-1 at the indicated concentration. Data are representative of three independent experiments. See also Figure 3—figure supplement 1 and Figure 3—source data 1–3.

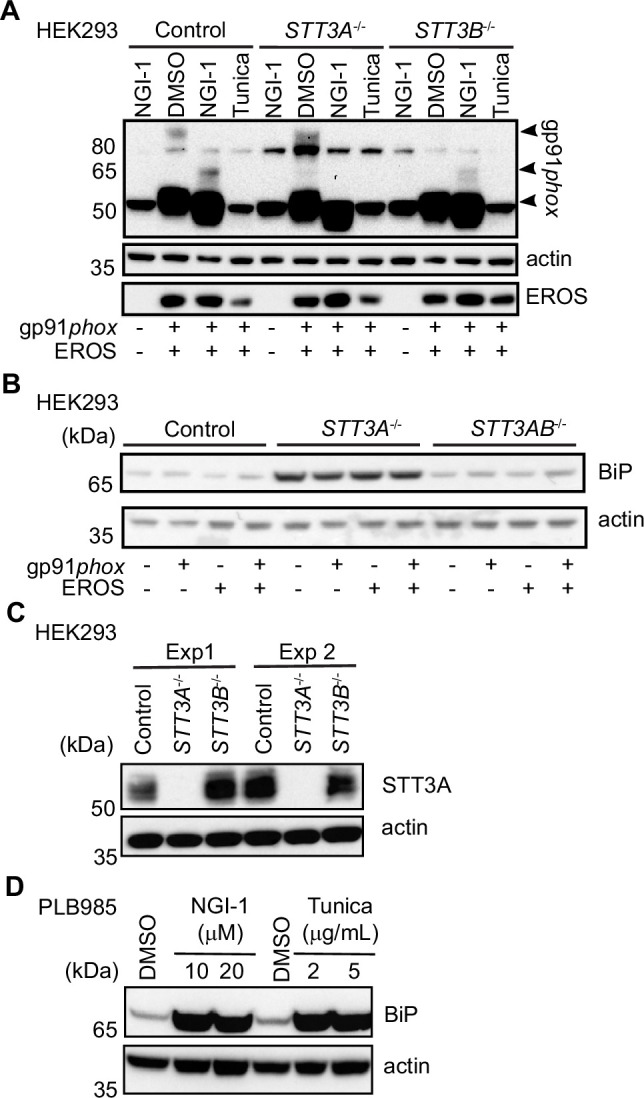
Figure 3—figure supplement 1. Analysis of gp91phox expression and ER-stress marker in different cell lines.