. 2022 Nov 24;11:e76387. doi: 10.7554/eLife.76387

Figure 5. EROS regulates P2X7 protein abundance by direct interaction and independently of the nicotinamide adenine dinucleotide phosphate (NADPH) oxidase.

(A–D) P2X7 expression analysed by Western blotting of macrophages isolated from control, EROS knockout (KO) (A) and gp91phox KO mice (B), induced pluripotent stem cells (iPS)-derived macrophages control or EROS-deficient (C) and of control PLB985 cells and an EROS-deficient clone (D). (E, F) P2X7 expression in RAW264.7 cells overexpressing a FLAG-tagged EROS vector (E) and in HEK293 cells transiently expressing the specified constructs (F). (G, H) Interaction between EROS and P2X7 probed by immunoprecipitation (IP) of EROS from RAW264.7 EROS-FLAG macrophages followed by immunoblot (IB) for P2X7 (G) and by Nanoluc Binary Technology (NanoBIT) assay in live HEK293 cells expressing the LgBIT-fused EROS vector with a SmBIT-fused P2X7 vector (H). (I) P2X1 expression in macrophages isolated from EROS KO mice compared to control. n = 5 biological replicates. (J) P2X1 abundance upon co-transfection with EROS construct in HEK293 cells. Data are representative of hree independent experiments; error bars indicate SEM of triplicates. See also Figure 5—figure supplement 1 and Figure 5—source data 1–4.

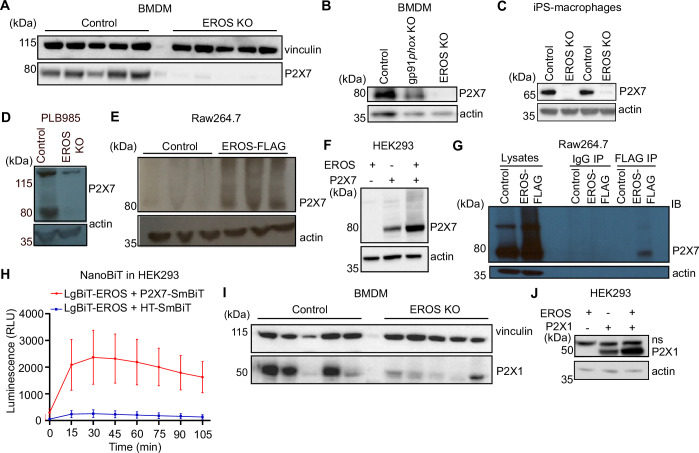
Figure 5—source data 1. Raw unedited blots for Figure 5A–D.
Figure 5—source data 2. Raw unedited blots for Figure 5E–G.
Figure 5—source data 3. Raw unedited blots for Figure 5I and J.
Figure 5—source data 4. Uncropped gels used for Figure 5A–G, I, J.

Figure 5.

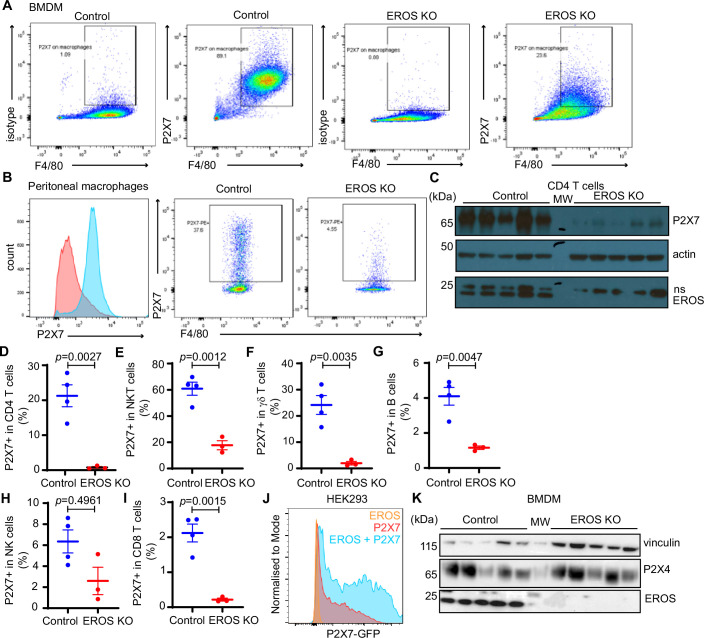
Figure 5—figure supplement 1. P2X7 expression is lower in numerous cell subsets from EROS knockout (KO) mice.

Figure 5—figure supplement 1.

(A) P2X7 measured by surface flow cytometry staining of bone marrow-derived macrophages (BMDM) from control and EROS KO mice. (B) P2X7 level in peritoneal macrophages from control and EROS KO mice expressed by mean fluorescence intensity (left panel) and percentage of positive cells (right panel). (C) Western blot of P2X7, EROS, and actin expression in control and EROS-deficient whole splenic CD4 T cells. (D–I) Percentage of cells that are P2X7 positive in the specified splenic cell subsets. (J) Expression of P2X7 in HEK293 cells measured by flow cytometry following co-transfection with EROS. (K) Expression of the P2X7 homologue P2X4 in control and EROS-deficient BMDM analysed by Western blotting with the indicated antibody. n = 3–5 biological replicates. p-Value was determined using Student’s t-test; error bars indicate SEM. See also Figure 5—figure supplement 1—source data 1 and 2.
Figure 5—figure supplement 1—source data 1. Raw unedited blots for Figure 5—figure supplement 1C and K.
Figure 5—figure supplement 1—source data 2. Uncropped gels used for Figure 5—figure supplement 1C and K.