

Abstract
Exercise confers robust protection against obesity, type 2 diabetes, and other cardiometabolic diseases.1–5 However, the molecular and cellular mechanisms that mediate the metabolic benefits of physical activity remain unclear.6 Here we show that exercise stimulates production of Lac-Phe, a blood-borne signaling metabolite that suppresses feeding and obesity. Lac-Phe biosynthesis from lactate occurs in CNDP2+ cells including immune cells, epithelial cells, and mesenchymal stem cells localized to diverse organs. In diet-induced obese mice, pharmacological elevation of circulating Lac-Phe reduces food intake without affecting movement or energy expenditure. Chronic administration of Lac-Phe decreases adiposity and body weight and improves glucose homeostasis. Conversely, genetic ablation of Lac-Phe biosynthesis in mice increases food intake and obesity following exercise training. Lastly, dramatic activity-inducible elevations of circulating Lac-Phe levels are also observed in humans and racehorses, establishing this metabolite to be a robust molecular effector associated with physical activity across multiple activity modalities and mammalian species. These data define a conserved exercise-inducible metabolite that controls food intake and influences systemic energy balance.
Exercise is a powerful physiologic intervention that protects against obesity and obesity-associated cardiometabolic diseases1–5 while physical inactivity increases the risk of obesity, metabolic disease, and mortality.4,5 There has been a growing recent interest in identifying “molecular transducers” that might mediate the cardiometabolic benefits of exercise.6 While large-scale multi-omic efforts (e.g., MoTrPAC) have begun to generate molecular maps of the biological molecules regulated by physical activity,6–9 the functional relationship between these molecular changes and physiologic outcomes remain poorly defined. In parallel, candidate approaches have also uncovered specific functional exercise-regulated signaling molecules,10–14 but the extent to which these candidate molecules represent the most robust or important mediators of physical activity remains unclear. We reasoned that a hybrid approach might be valuable in both providing a global view of the most robust molecular changes associated with physical activity and also designating high-priority, candidate molecular transducers of exercise.
Metabolomics of mouse and horse exercise
To measure exercise-induced circulating metabolites in a global and unbiased manner, we performed both targeted and untargeted metabolomics on blood plasma from mice following an acute bout of treadmill running until exhaustion (Extended Data Fig. 1a). Our targeted metabolomic analysis detected increases in several metabolites, including lactate, fumarate, and succinate, previously established to be regulated by physical activity7,8,12,15–17 (Fig. 1a and Supplementary Table 1; also see Methods). The metabolite most significantly induced by exercise, however, was found by untargeted metabolomics (Fig. 1a,b). This metabolite had a mass-to-charge ratio (m/z) of 236.0928, consistent with a chemical formula of [C12H14NO4]−, but such a molecule did not match a metabolite in our original targeted list.
Fig. 1. Lac-Phe is robustly induced in blood plasma after a single bout of running in mice and racehorses.
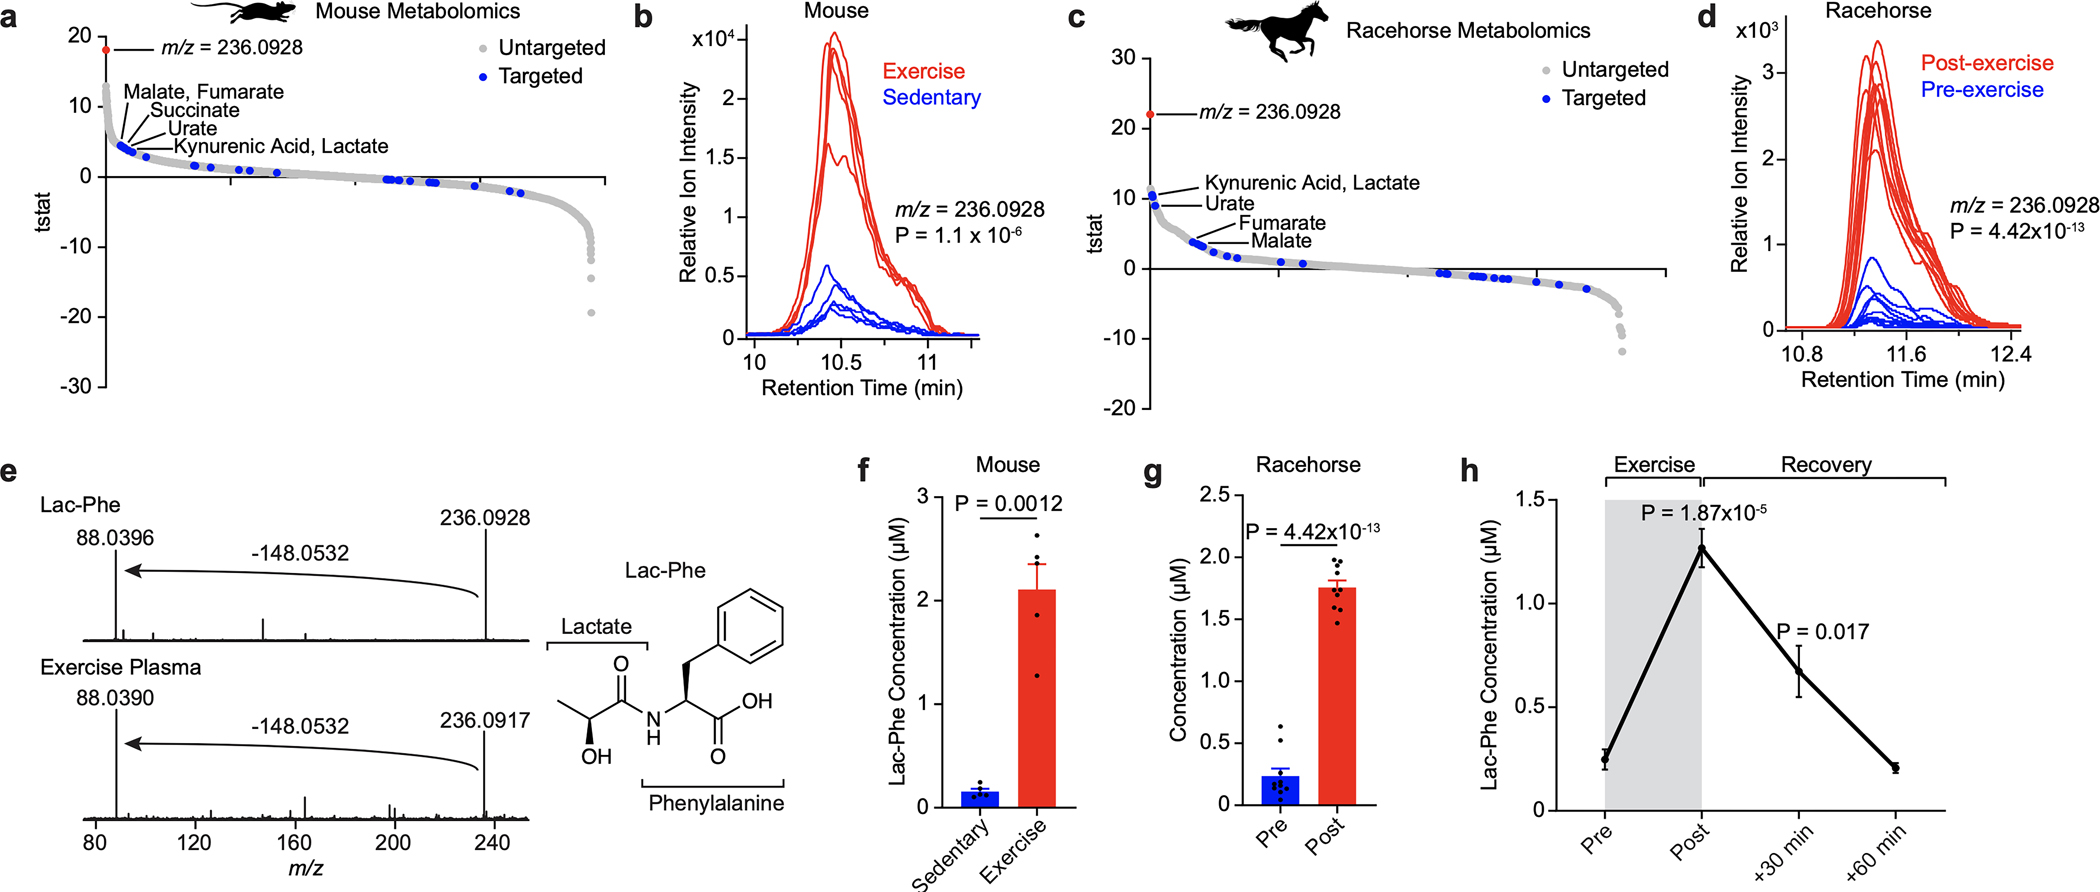
(a-d) T-statistic of all blood plasma peaks detected by targeted (blue circles) or untargeted (grey circles) metabolomics in post-run versus control mice (a) and racehorses (c), and extracted ion chromatogram of the top m/z = 236.0928 mass in mice (b) and racehorses (d).
(e) Tandem MS fragmentation (left) and structural assignment (right) of an authentic Lac-Phe standard (top) and endogenous m/z = 236.0928 mass (bottom) from mouse plasma.
(f,g) Absolute quantitation of Lac-Phe in mouse (f) or racehorse (g) plasma.
(h) Time course of Lac-Phe in blood plasma after a single bout of exhaustion running in mice.
For (a), (b), and (f), N=5/group. For (c), (d), and (g), N=10/group. Data are shown as means ± SEM. The experiments in (a-e) were performed once; the experiments in (f-g) were performed three times; and the experiments in (h) were performed two times. P-values were calculated by Student’s two-sided t-test.
We also performed targeted and untargeted metabolomics on pre- and post-race plasma from thoroughbred racehorses. Racehorses exhibit the highest fractional increase in oxygen consumption reported for any mammal (~45-fold increase in VO2) and have long been studied for their superior athletic performance.18 Remarkably, the same m/z = 236.0928 molecule was once again detected by untargeted metabolomics as the most significant exercise-inducible metabolite change (Fig. 1c,d and Supplementary Table 1).
Fragmentation of the 236.0928 metabolite revealed a prominent daughter ion of m/z = 88.040 which matched [C3H6NO2]− (Fig. 1e). Based on these spectra, the parent metabolite was tentatively assigned to N-lactoyl-phenylalanine, a peptide conjugate of lactate and phenylalanine (“Lac-Phe”, Fig. 1e). An authentic Lac-Phe standard produced by chemical synthesis exhibited identical fragmenttion spectra (Fig. 1e) and retention times (Extended Data Fig. 1b–d) as the endogenous m/z = 236.0928 peak. Absolute quantitation of circulating Lac-Phe levels in mice and racehorses revealed peak concentrations of ~2 μM after exercise (Fig. 1f,g). Plasma Lac-Phe levels in mice were dramatically increased immediately after running and returned to baseline by 1 hr post-exercise (Fig. 1h). Lac-Phe could also be detected in multiple mouse tissues, but tissue Lac-Phe levels were unaltered by acute running (Extended Data Fig. 1e). Several additional lactoyl amino acids were found to be increased in plasma after acute running in both mice and racehorses, with conjugates of lactate and hydrophobic amino acids exhibiting the most dramatic exercise-inducible changes (Extended Data Fig. 1f,g). We conclude that Lac-Phe is the most statistically significantly induced circulating metabolite in two animal models of exercise.
Lac-Phe production via CNDP2 and lactate
Lac-Phe is a poorly studied metabolite of unknown function.19–23 Increased Lac-Phe by exercise has been previously reported once.22 Our metabolomic data further contextualize this increase as one of the most robust metabolite changes in acute exercise. Jansen et al.22 also showed that the cytosolic enzyme CNDP2 can catalyze Lac-Phe synthesis in vitro by condensation of lactate and phenylalanine (Extended Data Fig. 2a), but the physiologic relevance of this biochemical reaction has remained unclear. From the single cell Tabula Muris database,24 Cndp2 mRNA exhibited wide-spread expression across diverse cell types (Fig. 2a and Extended Data Fig. 2b), including macrophages/monocytes, other immune cells, epithelial cells, and mesenchymal stem cells. We used the murine RAW264.7 macrophage cell line to model Lac-Phe production in vitro. Even though CNDP2 is an intracellular enzyme, nearly all the Lac-Phe from RAW264.7 cells was found secreted in the conditioned media (Fig. 2b). In CNDP2-KO macrophage cell lines generated by CRISPR/Cas9, extracellular Lac-Phe levels were reduced by >75% (Fig. 2b and Extended Data Fig. 2c). Addition of lactate to the conditioned media (25 mM) increased extracellular levels of Lac-Phe by +85% (Fig. 2c). Similar lactate-stimulated, CNDP2-dependent Lac-Phe production was also observed in two additional epithelial cell lines (bladder RT4 and kidney TKPTS, Fig. 2d–g and Extended Data Fig. 2d,e). CNDP2 protein levels were not changed in multiple mouse tissues after a single bout of running to exhaustion (Extended Data Fig. 2f–h). Lac-Phe is therefore a secreted metabolite produced by CNDP2 and regulated by extracellular lactate. The high levels of blood lactate achieved during exercise and the robust secretion of Lac-Phe are two factors that likely drive what would otherwise be a thermodynamically unfavorable intracellular condensation reaction.
Fig. 2. CNDP2- and lactate-dependent production and secretion of Lac-Phe in vitro.
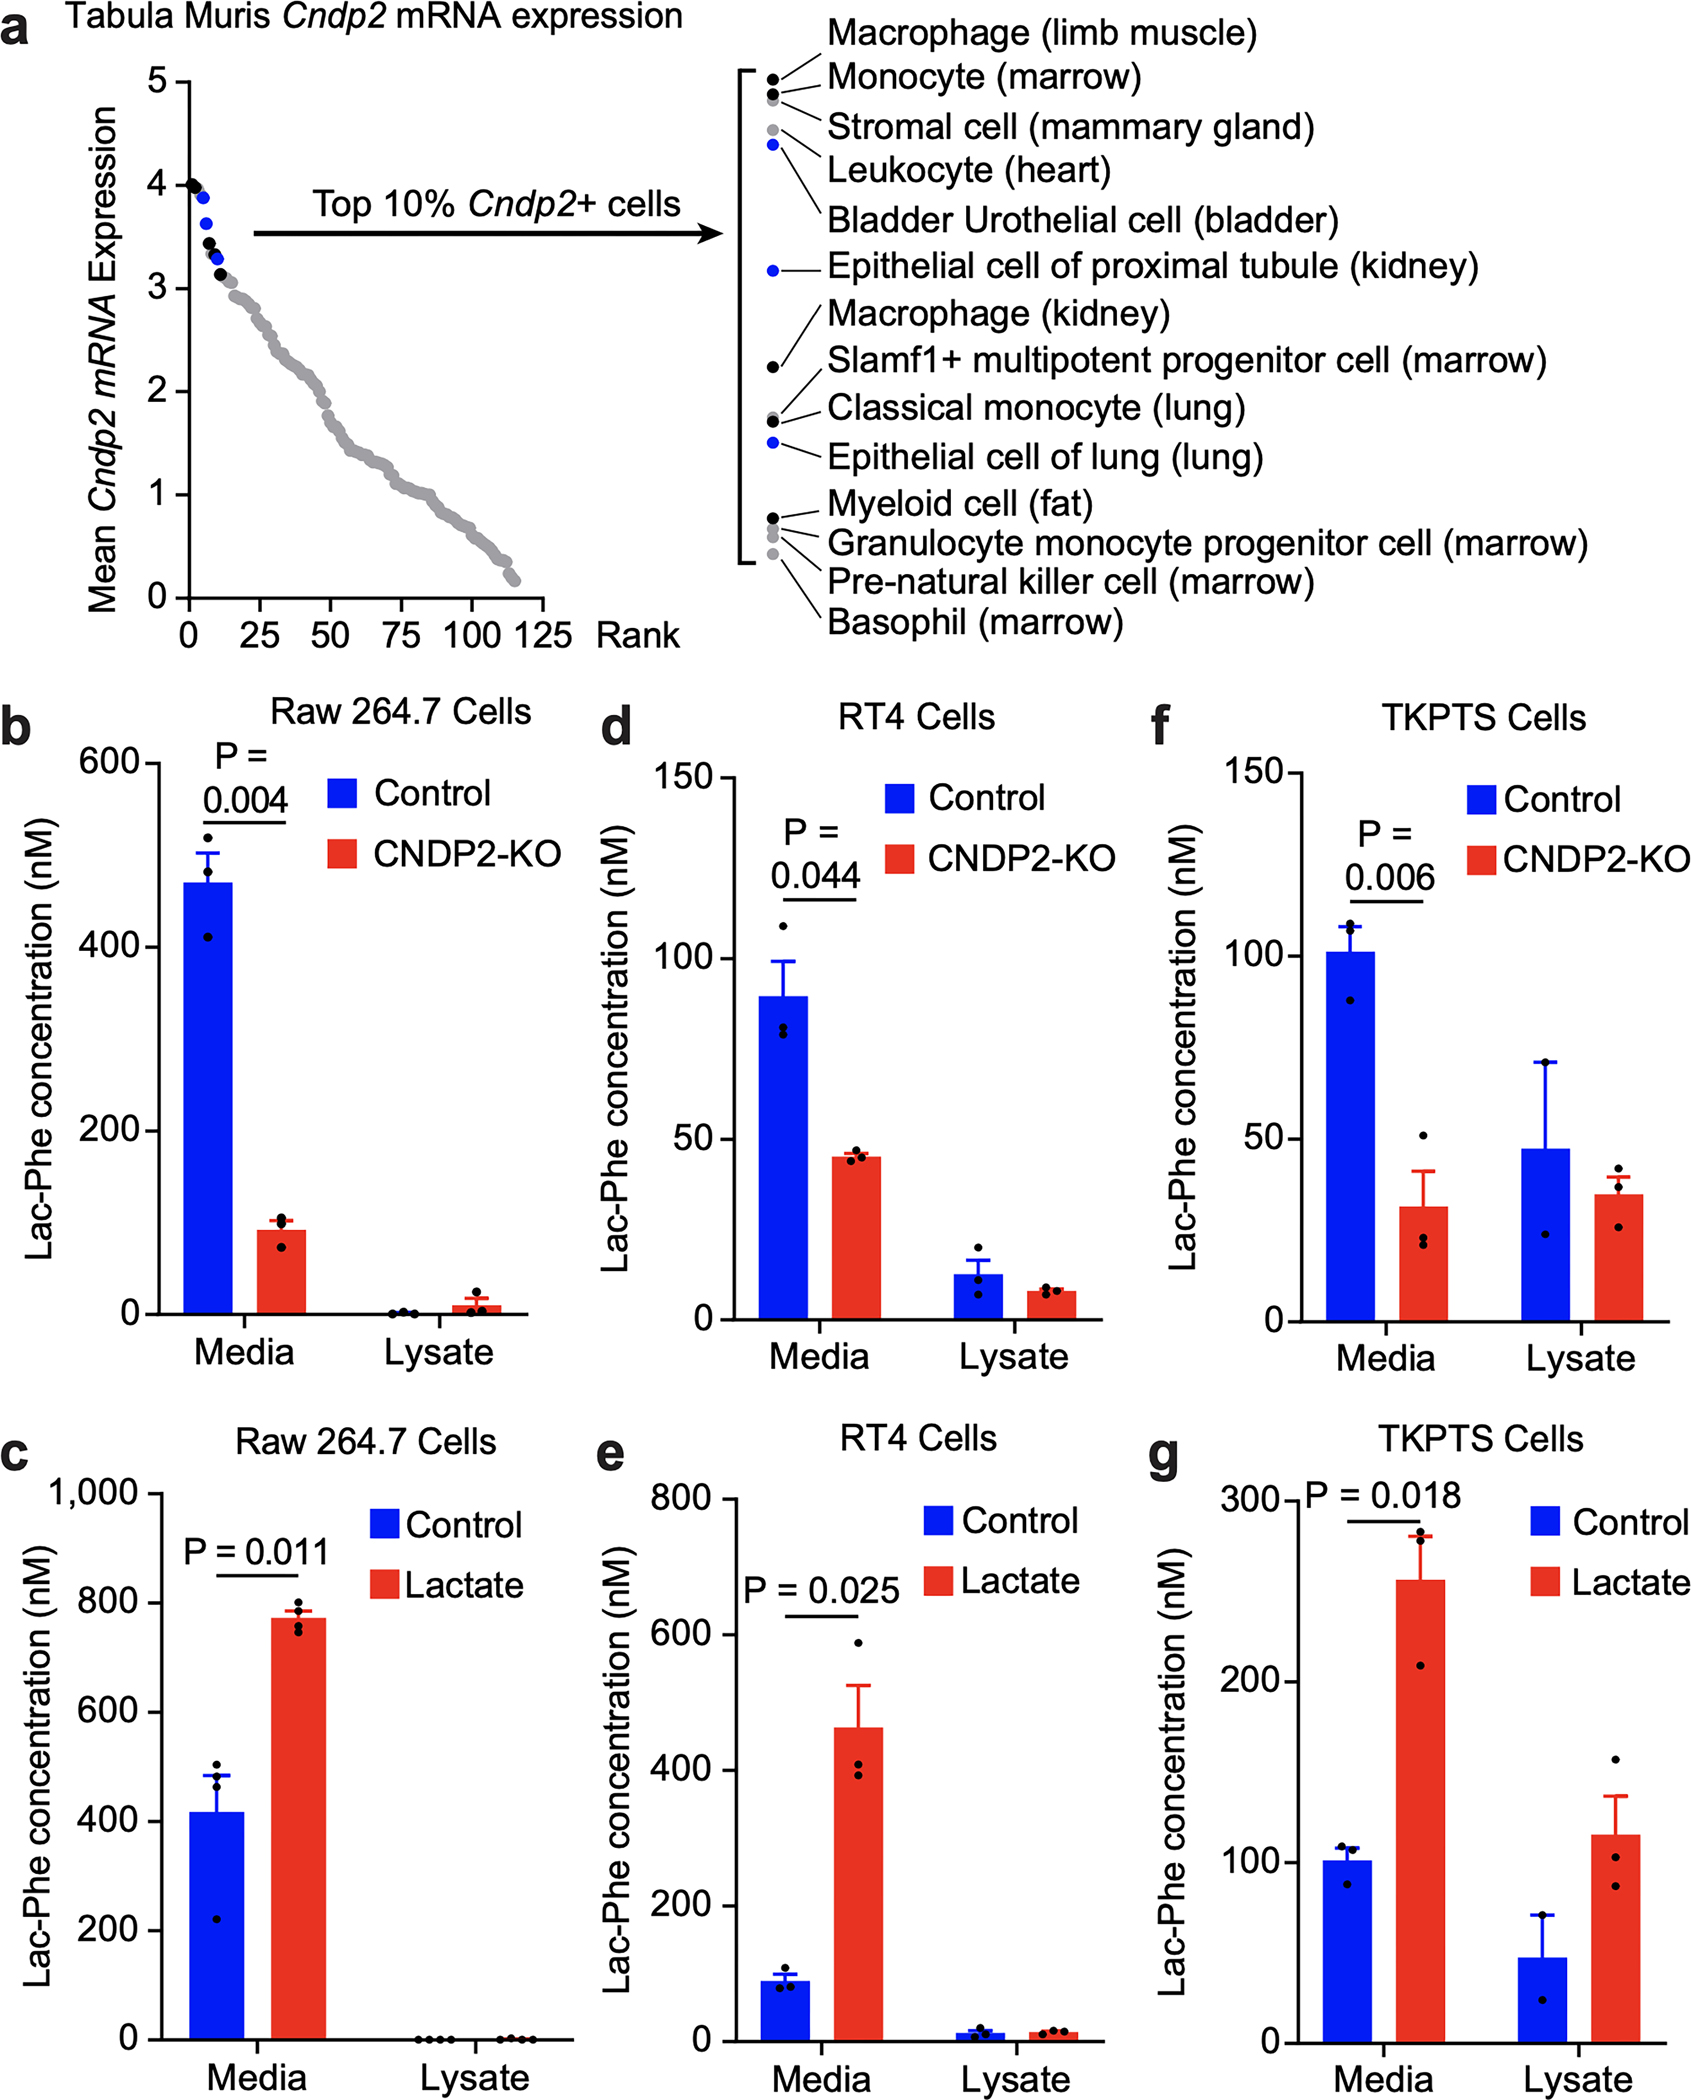
(a) Mean Cndp2 mRNA expression across mouse cells and tissues from Tabula Muris. Highlighted black dots, monocytes/macrophages; highlighted blue dots, epithelial cells.
(b-g) Lac-Phe levels in conditioned media and cell lysate of WT and CNDP2-KO RAW264.7 macrophage cells (b,c), RT4 bladder epithelial cells (d,e), or TKPTS kidney epithelial cells (f,g) under the indicated condition. Lactate-treated cells were supplemented with 25 mM lactate for 24 h.
For (b-i) N=3/group. Data are shown as means ± SEM. The experiments shown in (b) was performed three times and the experiments in (c-g) were performed once. P-values were calculated by Student’s two-sided t-test.
Lac-Phe suppresses feeding and obesity
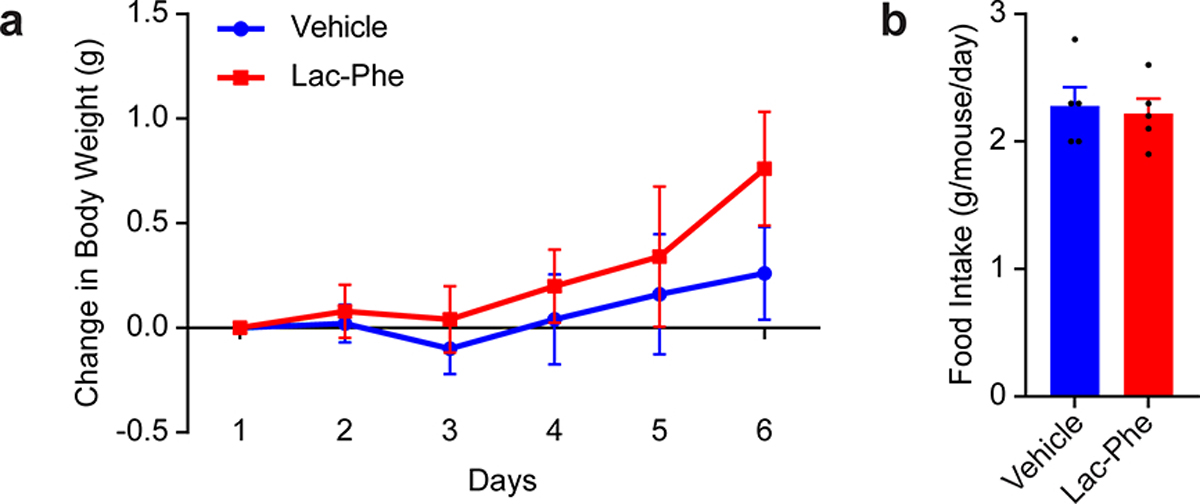
In the Type 2 Diabetes Knowledge Portal,25 two missense single nucleotide polymorphisms in human CNDP2 were associated with body mass index (rs373836366: D279N, P = 2.54e-6; beta = +0.4857; and rs780772968: K374T, P = 8.48e-4; beta = +0.7144) (Extended Data Fig. 3a,b). Based on these observations, we hypothesized that exercise-inducible Lac-Phe might function as a molecular signal to regulates energy balance. Metabolic chambers were therefore used to determine the effect of acute Lac-Phe elevation on whole-body energy parameters in diet-induced obese (DIO) mice. Lac-Phe was administered at a dose that increased circulating levels (50 mg/kg, intraperitoneal [IP], Extended Data Fig. 3c). Blood lactate levels were unchanged under these conditions (Extended Data Fig. 3d). Acute Lac-Phe suppressed food intake by ~50% compared to vehicle-treated mice over a period of 12 h (Fig. 3a). Importantly, ambulatory activity was not different between groups (Fig. 3b), demonstrating that the suppression of feeding behaviors was not simply due to reduction in movement. Acute Lac-Phe treatment also did not alter oxygen consumption (VO2), carbon dioxide production (VCO2), or respiratory exchange ratio (RER, Extended Data Fig. 3e–g). In a separate cohort of DIO mice, Lac-Phe did not alter kaolin or water intake, demonstrating that a component of nausea is not involved in its hypophagic effects (Extended Data Fig. 3h–j). Lac-Phe also did not alter circulating levels of other appetite-regulating hormones, including leptin and ghrelin (Extended Data Fig. 3k,l). In chow-fed, lean mice, Lac-Phe did not suppress food intake, even at up to 3-fold higher doses (150 mg/kg, IP, Extended Data Fig. 4). These data demonstrate that pharmacological administration of Lac-Phe to obese, but not lean mice specifically suppresses energy intake without altering energy expenditure pathways.
Fig. 3. Lac-Phe suppresses food intake and obesity and improves glucose homeostasis.
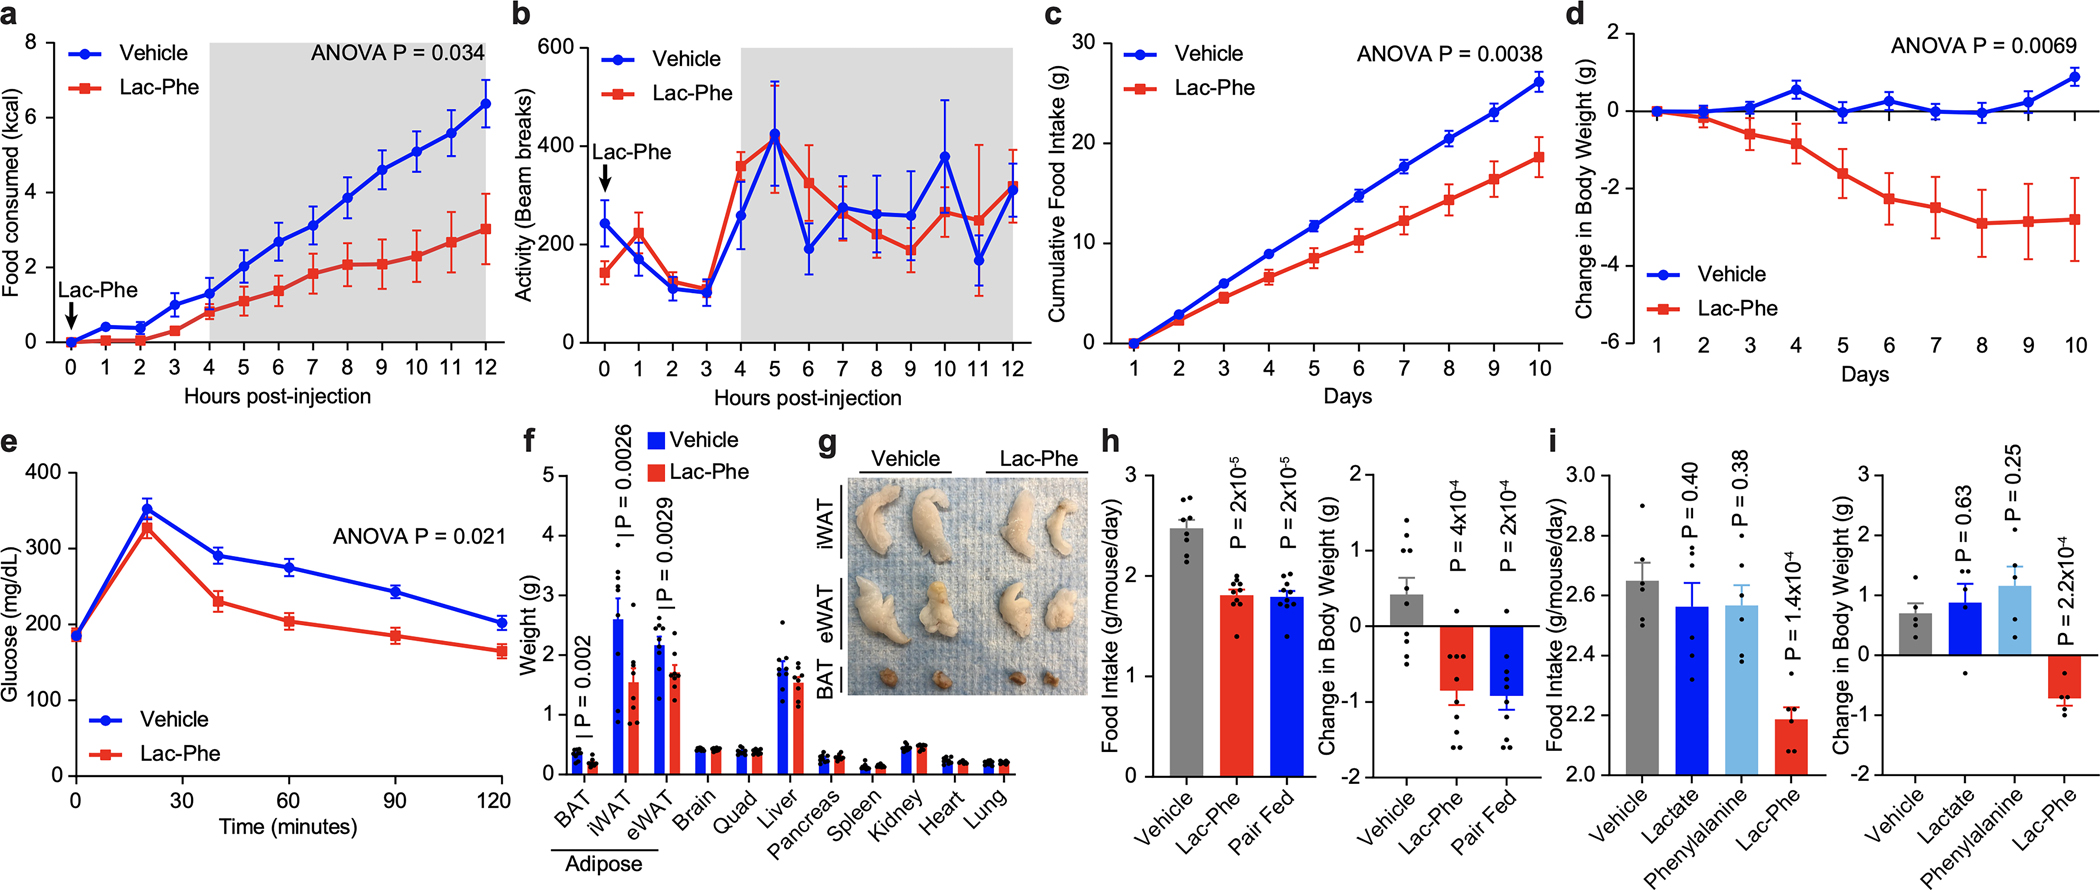
(a,b) Cumulative food intake (a) and ambulatory activity (b) of 22-week male DIO mice following injection of either vehicle (blue) or Lac-Phe (red, 50 mg/kg, intraperitoneal [IP]).
(c,d) Cumulative food intake (c) and change in body weight (d) of 22-week male DIO mice treated daily with vehicle (blue) or Lac-Phe (red, 50 mg/kg/day, IP).
(e) Glucose tolerance test (1 g/kg glucose) of vehicle- or Lac-Phe treated mice. This assay was performed after a 6 h fast one day following the last Lac-Phe dose on day 10.
(f-g) Tissue weights (f) and representative images of adipose tissues (g) from mice after 10 days of vehicle or Lac-Phe treatment. iWAT, inguinal white adipose tissue; eWAT, epididymal white adipose tissue; BAT, brown adipose tissue.
(h) Average daily food intake (left) and change in body weight (right) of 15-week male DIO mice after 5-day treatment with vehicle (grey), Lac-Phe (red, 50 mg/kg/day, IP) or vehicle-treated pair-fed mice (blue).
(i) Average daily food intake (left) and change in body weight (right) of 13-week male DIO mice after 7-day treatment with vehicle (grey), lactate (blue, 50 mg/kg/day, IP), phenylalanine (green, 50 mg/kg/day, IP), or Lac-Phe (red, 50 mg/kg/day, IP).
For (a,b), N=6/group; for (c-g), N=9 for vehicle and N=8 for Lac-Phe groups; for (h), N=8 for vehicle, N=10 for Lac-Phe, and N=10 for pair fed groups; for (i), N=5/group. Data are shown as mean ± SEM. The experiments shown in (a,b) were performed once; the experiments shown in (c-d) were performed three times; and the experiments shown in (e-i) were performed once. P-values were calculated by two-way ANOVA with repeated measures (for a-e) and Student’s two-sided t-test (for f-i).
Chronic administered of Lac-Phe to DIO mice (50 mg/kg/day, IP, for 10 days) resulted in reduced cumulative food intake and reduced body weight compared to control mice (Fig. 3c,d). After 10 days, mice treated with Lac-Phe also exhibited improved glucose homeostasis (Fig. 3e) and reduced adiposity (Fig. 3f,g) without any changes in the sizes of the other organs (Fig. 3f). Oral dosing of Lac-Phe in obese mice did not suppress food intake or body weight (Extended Data Fig. 5), likely due to the chemical lability of the Lac-Phe peptide bond in the digestive system. Control pair-fed mice exhibited identical changes to body weight as mice treated with Lac-Phe (Fig. 3h), confirming that the effects of Lac-Phe on adiposity and obesity are solely due to its effects on energy intake. Lastly, Lac-Phe suppressed food intake and body weight whereas lactate and phenylalanine were each without effect (Fig. 3i), demonstrating that the intact peptide conjugate is required for the effects of Lac-Phe on energy balance. We conclude that chronic Lac-Phe treatment reduces adiposity, obesity, and improves glucose tolerance.
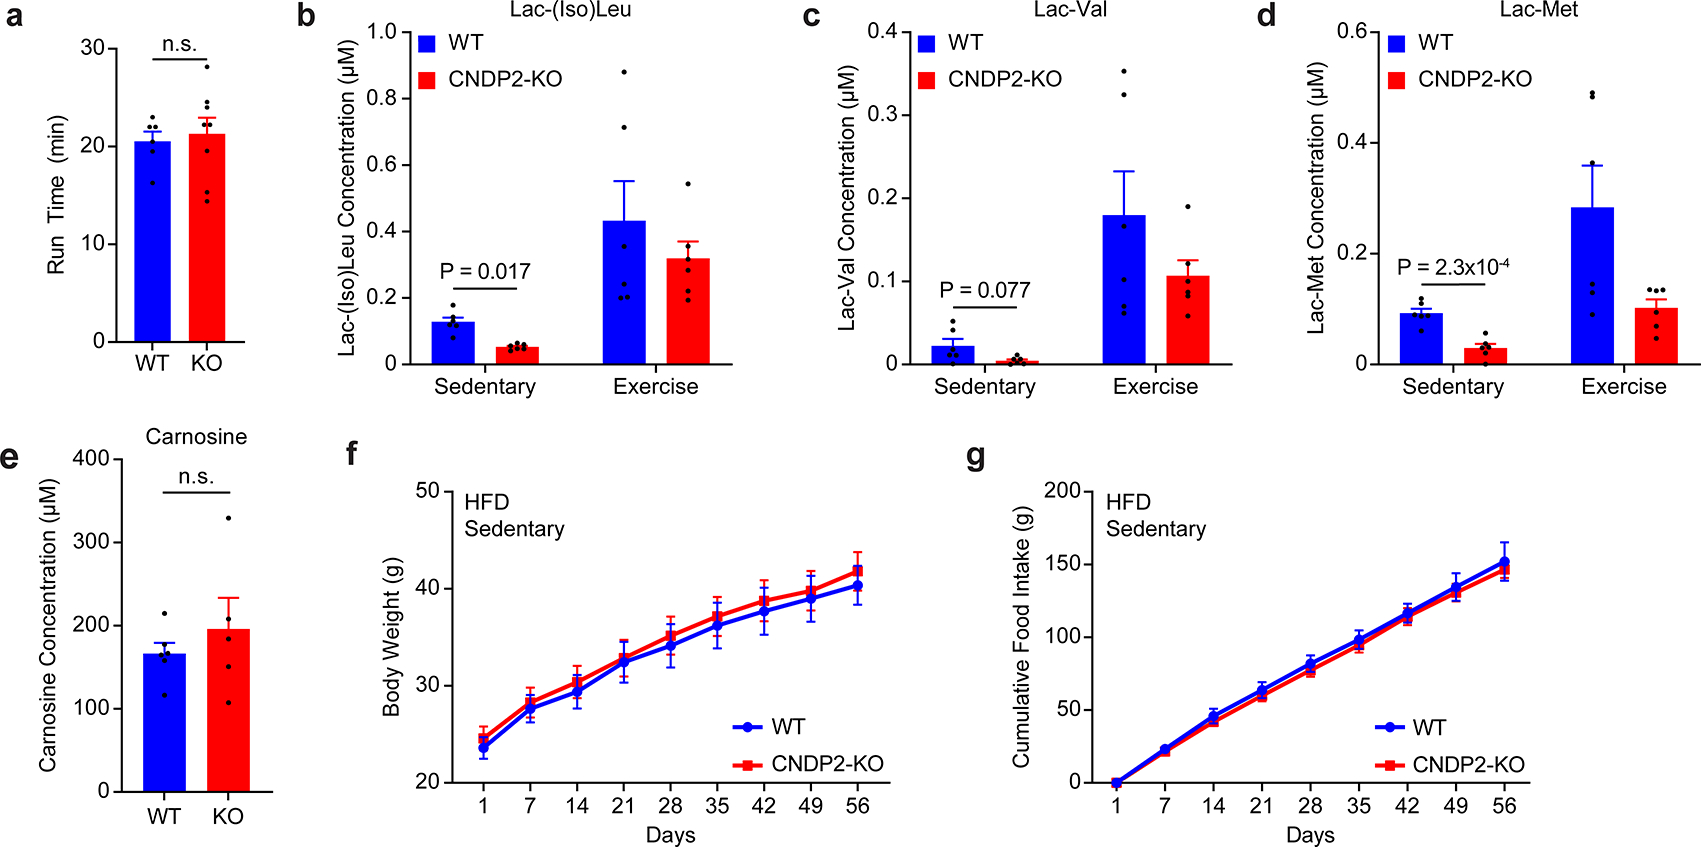
To determine the physiologic contribution of Lac-Phe to the anti-obesity effects of exercise, we used global CNDP2-KO mice as a genetic model of Lac-Phe deficiency. In CNDP2-KO mice, circulating Lac-Phe was dramatically reduced compared to WT mice in both the sedentary state and after a single bout of treadmill running, respectively (Fig. 4a). Acute run times to exhaustion were not different between genotypes (Extended Data Fig. 6a). Plasma levels of other lactoyl amino acids were also found to be reduced in CNDP2-KO mice under sedentary, but not exercised conditions (Extended Data Fig. 6b–d). By contrast, plasma carnosine levels were unchanged (Extended Data Fig. 6e). CNDP2 is therefore a principal biosynthetic enzyme responsible for basal and exercise-inducible Lac-Phe production in vivo.
Fig. 4. Increased food intake and obesity in mice genetically deficient in Lac-Phe.

(a) Plasma Lac-Phe levels in male WT (blue) and CNDP2 KO (red) mice under sedentary conditions or after a single bout of exhaustive treadmill running.
(b,c) Cumulative daily food intake (b) and body weight (c) of male WT (blue) and CNDP2-KO (red) mice under an obesigenic diet/exercise training regimen in which mice were fed high fat diet (60% kcal from fat) and exercised by treadmill running 5 days/week (see Methods).
(d) Change in body weight of WT (blue) and CNDP2-KO (“KO”, red) mice after 40 days of obesogenic diet alone (“HFD/Sedentary”) or obesogenic diet with treadmill running (“HFD/Exercise”).
(e,f) Tissue weights (e) and representative images of adipose tissues (f) of WT (blue) and CNDP2-KO (red) mice following a combined obesogenic diet/treadmill running protocol. Tissue weights and images were taken on day 41. iWAT, inguinal white adipose tissue; eWAT, epididymal white adipose tissue; BAT, brown adipose tissue.
For (a), N=6/group. For (b,c) and (e,f), N=8 for WT and N=8 for CNDP2-KO. For (d), N=8 for WT HFD/Sedentary, N=11 for CNDP2-KO HFD/Sedentary, N=9 for WT HFD/Exercise, and N=8 for CNDP2-KO HFD/Exercise. Data are shown as mean ± SEM. The experiments shown in (a-c) were performed two times and the experiments shown in (d-f) were performed once. P-values were calculated by two-way ANOVA with repeated measures (for b,c) or Student’s two-sided t-test (for a, d, and e).
The metabolic phenotypes of high fat diet-fed (60% kcal from fat) WT and CNDP2-KO mice were next examined under basal, sedentary conditions. Over 8 weeks, WT and CNDP2-KO mice exhibited identical food intake and body weight (Extended Data Fig. 6f,g), demonstrating that reductions in basal Lac-Phe are not sufficient to alter energy balance. We therefore considered the possibility that exercise training would be required to uncover a metabolic phenotype of CNDP2-KO mice, similar to what has been reported for other exercise-inducible molecules.26 In a new cohort of WT and CNDP2-KO mice on high fat diet, we concurrently implemented a moderate treadmill running exercise protocol that had previously shown anti-obesity effects in rodents27 (40 min/day starting at 6 m/min and increasing by 2 m/min every 5 minutes, 5 days/week). Both genotypes ran equivalently with this chronic exercise protocol (mean ± SEM, WT 41 ± 1.2 min/day; KO 41 ± 1.7 min/day, P > 0.05). Starting from day 10, CNDP2-KO mice exhibited increased food intake compared to control mice (Fig. 4b). At this same time point, CNDP2-KO mice also increasingly diverged in their body weight compared to control mice (Fig. 4c). The chronic running protocol suppressed body weight by 75% in WT over the entire experiment, whereas only a 57% body weight suppression was observed in CNDP2-KO mice (P < 0.05, Fig. 4d). Lastly, dissection of tissues revealed an increase in adipose tissue mass in CNDP2-KO mice with no changes in lean mass (Fig. 4e,f). The 10-day delay of onset for the feeding phenotype may in part reflect the hypophagic action of Lac-Phe selectively in obese, but not lean animals (Fig. 3 and Extended Data Fig. 4). We therefore conclude that genetic ablation of Lac-Phe biosynthesis leads to increased energy intake and weight gain following exercise training, but not in the sedentary state.
The ATP transporter ABCC5 had been shown to mediate low-affinity Lac-Phe transport from cells in vitro.22 However, Lac-Phe levels did not differ between WT and global ABCC5-KO animals in either the sedentary state or after a single bout of running (Extended Data Fig. 7). These data demonstrate that genetic ablation of ABCC5 is not sufficient to alter circulating levels of Lac-Phe.
Lac-Phe levels in human exercise
Lac-Phe levels were next determined in two independent human exercise cohorts. First, we re-analyzed untargeted plasma mass spectrometry data from a previously published deeply phenotyped acute treadmill running exercise cohort (N=36, Fig. 5a).7 Remarkably, a yet unassigned peak corresponding to a metabolite with chemical formula matching Lac-Phe (C12H14NO4−) was ranked third most significantly induced by exercise in the entire dataset (Fig. 5b). Tandem mass spectrometry experiments confirmed that this previously unassigned metabolite in fact is Lac-Phe (Extended Data Fig. 8a,b). Plasma Lac-Phe levels showed a robust and sustained elevation by exercise (Fig. 5c). By comparison, lactate levels peaked at the cession of exercise and quickly returned to baseline at 1 h (Fig. 5c) and phenylalanine levels were unchanged (Extended Data Fig. 8c).
Fig. 5. Robust and sustained elevation of Lac-Phe following human exercise.

(a) Schematic of human acute treadmill exercise study design, N=36, “Cohort 1”.
(b) Exercise-regulated metabolites (dark blue), lipids (grey), or proteins (light blue) from blood plasma in Cohort 1. A previously unassigned metabolite with a chemical formula matching that of Lac-Phe (red) was ranked the third most exercise-regulated molecule in the entire dataset.
(c) Time course of Lac-Phe and lactate in blood in Cohort 1 after exercise in the non-exercised control group.
(d) Schematic of human crossover acute exercise study design, N=8, “Cohort 2”.
(e) Time course of Lac-Phe levels pre and post-exercise in Cohort 2.
(f) Correlation of plasma Lac-Phe and lactate levels immediately pre- and post-exercise across the three exercise modalities in Cohort 2.
Data are shown as mean ± SEM. The experiments were performed once. P-values were calculated by two-way ANOVA with repeated measures.
We also directly measured plasma Lac-Phe levels in a second human exercise cohort that consisted of individuals that had each been tested in three distinct exercise trials (N=8, endurance, sprint, and resistance, see Methods and Fig. 5d). Lac-Phe once again exhibited robust and sustained elevations across all three exercise modalities (Fig. 5e). Sprint exercise induced the most dramatic elevation of plasma Lac-Phe, followed by resistance training and then endurance training. Even at 3 h post-exercise, individuals in the sprint intervention still showed plasma Lac-Phe levels that were elevated over baseline (Fig. 5e). Furthermore, the pre- versus immediately post-exercise fold-change of Lac-Phe and lactate exhibited a strong correlation (Pearson r = 0.82, P < 0.0001, Fig. 5f and Extended Data Fig. 8d). These data establish Lac-Phe is one of the top exercise-regulated metabolites in humans. Distinct physical activity modalities in humans lead to different quantitative changes in circulating Lac-Phe levels that correlate with blood lactate concentration.
Discussion
Our metabolomic studies and functional characterization of Lac-Phe provide several new insights about the molecular responses to physical activity. The generation of a signaling molecule (Lac-Phe) from a metabolic fuel (lactate) establishes a functional and biochemical coupling between the metabolic state during exercise and long-lasting endocrine signaling. That macrophages, epithelial cells, and other CNDP2+ cell types secrete Lac-Phe suggests that many additional cell types beyond muscle can sense and respond to physical activity. Finally, while Lac-Phe inhibits feeding and obesity just like other metabolic hormones including GLP-1 and GDF15, we suspect the still unidentified receptor and the neural circuits activated by Lac-Phe are likely to be distinct. Future work uncovering the downstream molecular and cellular mediators of Lac-Phe action in the brain may provide new therapeutic opportunities to capture the cardiometabolic benefits of physical activity for human health.
Methods
Materials and Methods.
Cell line cultures.
All cell lines were obtained from ATCC and grown at 37°C with 5% CO2. RAW 264.7 and HEK293T cells were grown in Dulbecco’s modified Eagle’s medium (DMEM) with 10% fetal bovine serum (FBS) and penicillin/streptomycin (pen/strep). RT4 cells were grown in McCoy’s 5a medium with 10% FBS and pen/strep. TKPTS cells were grown in DMEM:F12 medium with 7% FBS, 0.006 mg/ml insulin, and pen/strep. All cell lines were used directly from ATCC vials and were not specifically authenticated for this study. Cell lines were negative upon testing for mycoplasma contamination.
General animal information.
Animal experiments were performed according to procedure approved by the Stanford University Administrative Panel on Laboratory Animal Care (APLAC). Studies with ABCC5-KO mice were approved by the Institute Animal Care and use Committee of the Netherlands Cancer Institute. Mice were maintained in 12-hr light-dark cycles at 22 °C and ~50% relative humidity and fed a standard irradiated rodent chow diet. Where indicated, high-fat diet (D12492, Research Diets 60% kcal from fat) was used. Male C57BL/6J (stock no. 000664) and male C57BL/6J DIO mice (stock no. 380050) were purchased from Jackson Laboratory. Male C57BL/6NCrl (stock no. 027) mice were purchased from Charles River Laboratory. Whole body CNDP2-KO mice (catalog number, C57BL/6NCrl-Cndp2em1(IMPC)Mbp/Mmucd, RRID: MMRRC_043492-UCD) were obtained from the Mutant Mouse Regional Resource Center, a NCRR-NIH funded strain repository. ABCC5-KO mice were obtained from De Wolf et al.28 For in vivo injection of mice with compounds including Lac-Phe, lactate, and phenylalanine, compounds were dissolved in 18:1:1 (by volume) of saline/Kolliphor EL (Sigma Aldrich)/DMSO. Compounds were administered to mice daily via intraperitoneal injections at 5 μl/g body weight at the indicated doses. For all injection experiments, mice were mock injected with the vehicle for 3–5 days until body weights have stabilized. For glucose tolerance tests, mice were fasted for 6 hours then injected with glucose at 10 μl/g body weight. A dose of 1 g/kg was used for the GTT of vehicle and Lac-Phe treated obese mice. Sample sizes were determined on the basis of previous experiments using similar methodologies. For metabolite administration experiments, mice were randomly assigned to treatment groups. Experimenters were not blinded to groups.
Horse information and plasma collection.
All horse plasma samples were obtained from anonymized diagnostic submissions and were therefore not classified as research samples. Racehorse blood (unmatched) was taken pre and immediately post-race. The pre-race samples were taken while the horses were resting in their stables. The post-race samples were taken immediately after a race lasting approximately 1–2 minutes at speeds of 9–11 m/s (> 95% maximum VO2). Plasma samples were collected by individual venipuncture into lavender-top tubes containing EDTA. Blood samples were then centrifuged at 4 °C to isolate the plasma then stored at −80 °C. Samples were shipped frozen to Stanford University where subsequent LC-MS analysis took place.
Chemicals.
L-Phenylalanine (AAA-1323814) was purchased from Fisher Scientific, sodium L-lactate (L7022) was purchased from Sigma. The synthesis of non-commercially available Lac-Phe is described below.
Synthesis of Lac-Phe (N-lactoyl phenylalanine).
Sodium L-lactate (1.2 eq.) was dissolved in dichloromethane (0.2 M) and treated with 3-[bis(dimethylamino)methyliumyl]-3H-benzotriazol-1-oxide hexafluorophosphate (HBTU, 1.2 eq.) at 0 °C under argon. After 15 minutes, phenylalanine methyl ester hydrochloride (1.0 eq.) and N, N-diisopropylethylamine (3.0 eq.) in dichloromethane (0.2 M) was added to the mixture. The reaction was stirred for 16 hours under argon at ambient temperature. One third of the solvent was removed and the dichloromethane solution washed with 5% HCl, 5% NaHCO3, and saturated NaCl solutions. The organic layer was dried (MgSO4), filtered, and concentrated. The resulting crude product was purified by column chromatography, eluting with ethyl acetate/hexane to afford the N-lactoyl phenylalanine methyl ester. The above ester (1.0 eq.) was dissolved in THF (0.5 M) and treated with lithium hydroxide monohydrate (2.0 eq.) in water (0.5 M). The solution was stirred at ambient temperature for 2 hours, and the solvent removed. The resulting residue was dissolved in dichloromethane and acidified by 5% HCl to pH 3. The resulting mixture was extracted with ethyl acetate three times and the combined organic layers washed with saturated NaCl solution. The organic layer was dried (MgSO4), filtered, and concentrated. The resulting crude product was purified with recrystallization with ethyl acetate/hexane to give the N-lactoyl phenylalanine as a white powder. 1H-NMR (400 MHz, D2O) δ 7.3–7.2 (m, 5H), 4.13 [dd, 1H], 4.10 [q, 1H], 3.21 [dd, 1H], 2.98 [dd, 1H], 1.10 [d, 3H]. LC/MS (m/z): 236.093 [M-H]−
Mouse running protocols.
A 6 lane Columbus Instruments animal treadmill (product 1055-SRM-D65) was used. Prior to treadmill running, mice were acclimated to the treadmill for 5 minutes. For acute exercise studies to exhaustion, treadmill running began at a speed of 7.5 m/min and a 4° incline. Every three minutes the speed and incline were increased by 2.5 m/min and 2°, respectively. Once a speed of 40 m/min and incline of 30° was reached, both parameters were kept constant until mice reached exhaustion. Exhaustion was defined as when the mice remained on the shocker at the back of the treadmill for longer than 5 seconds. For chronic running experiments with WT and CNDP2-KO mice, mice were exercised 5 days/week, Monday through Friday while on high fat diet (60% kcal from fat). Mice were allowed to rest over the weekend. Treadmill running was performed at a constant 5° incline and began at a speed of 6 m/min. Speed was increased by 2 m/min every 5 minutes until a maximum speed of 30 m/min. Mice were stopped upon reaching exhaustion as described above and run times were normalized between the two groups of mice. Running was performed in the mid-afternoon for all experiments (between 1–4pm).
Preparation of plasma samples for LC-MS analysis.
Plasma was collected from mice via a submandibular bleed into lithium heparin tubes (BD, 365985) and immediately transferred onto ice. The blood was centrifuged at 4 °C at 5000 rpm for 5 min and the top layer of plasma was aliquoted and frozen at −80 °C. To extract polar metabolites from plasma for LC-MS analysis, 150 ul of a 2:1 mixture of acetonitrile/methanol was added to 50 μl of plasma. The mixture was centrifuged at 4 °C for 10 min at 15,000 rpm and the supernatant was transferred to a LC-MS vial.
Untargeted measurements of metabolites by LC-MS.
Untargeted metabolomics measurements were performed on an Agilent 6520 Quadrupole Time-of-Flight (Q-TOF) LC/MS. Mass spectrometry analysis was performed using electrospray ionization (ESI) in negative mode. The dual ESI source parameters were set as follows, the gas temperature was set at 250 °C with a drying gas flow of 12 l/min and the nebulizer pressure at 20 psi. The capillary voltage was set to 3500 V and the fragmentor voltage set to 100 V. Separation of polar metabolites was conducted on a Luna 5 μm NH2 100 Å LC column (Phenomenex 00B-4378-E0) with normal phase chromatography. Mobile phases were as follows: Buffer A, 95:5 water/acetonitrile with 0.2% ammonium hydroxide and 10 mM ammonium acetate. Buffer B, acetonitrile. The LC gradient started at 100% B with a flow rate of 0.2 ml/min from 0–2 min. The gradient was then increased linearly to 50% A/50% B at a flow rate of 0.7 ml/min from 2–20 minutes. From 20–25 minutes the gradient was maintained at 50% A/50% B at a flow rate of 0.7 ml/min. Differential peak identification was performed with XCMS.29
Targeted metabolomics.
Targeted measurements of performed on an Agilent 6470 Triple Quadrupole (QQQ) LC/MS. Mass spectrometry analysis was performed using electrospray ionization (ESI) in negative mode. The AJS ESI source parameters were set as follows, the gas temperature was set at 250 °C with a gas flow of 12 l/min and the nebulizer pressure at 25 psi. The sheath gas temperature was set to 300 °C with the sheath gas flow set at 12 l/min. The capillary voltage was set to 3500 V. Separation of polar metabolites was performed as described above in the untargeted metabolomics section. Multiple reaction monitoring (MRM) was performed for the indicated metabolites with the listed dwell times, fragmentor voltage, collision energies, cell accelerator voltages, and polarities. For targeted measurements of exercise-inducible metabolites, we selected metabolites previously reported from the following references: Schranner et al.,17 Roberts et al.,10 Agudelo et al.,30 Stanford et al.,11 Reddy et al.,12 and Coxon et al.31 The mass spectrometry ionization parameters for the targeted metabolomics can be found in Supplementary Table 1. Quantification of the endogenous metabolite concentrations were performed by generating a standard curve with known concentrations of each metabolite. Metabolite standards were analyzed alongside the plasma samples using the same targeted QQQ method. A standard curve generated from the metabolite concentrations and total ion intensities were used to calculate the endogenous concentrations of each metabolite. The dilution of the plasma during the sample preparation was also taken into account for the quantification.
Generation of CNDP2-KO cells.
The plentiCRISPRv2 system developed by the Zhang lab was used to generate all CNDP2-KO cells. For murine cell lines, the sgRNA used was 5’-CAGTGAAATGAGATCCGTCA-3’. For human cell lines, the sgRNA used was 5’-ACAGAAACTCGCAAAATGGG-3’. Following Zhang lab protocols, oligonucleotides for the sgRNA and reverse complement sequences were synthesized and cloned into the plentiCRISPRv2 vector (For murine cell lines, forward oligo, 5’-CACCGCAGTGAAATGAGATCCGTCA-3’; reverse oligo, 5’-AAACTGACGGATCTCATTTCACTGC-3’. For human cell lines, forward oligo, 5’-CACCGACAGAAACTCGCAAAATGGG-3’; reverse oligo, 5’-AAACCCCATTTTGCGAGTTTCTGTC-3’.). Lentivirus particles were generated in the HEK293T cell line using polyfect for the co-transfection of the cloned plentiCRISPRv2 plasmid with the viral packing psPAX2 plasmid, and viral envelope pMD2.G plasmid. A parental plentiCRISPRv2 plasmid was used as a control. Lentiviral supernatants were harvested after 24 hours and filtered through a 0.45 uM filter. The supernatant was then mixed in a 1 to 1 ratio with polybrene to a final concentration of 8 ug/ml polybrene. This mixture was added to cells at 40–50% confluence in 6-well plates. Transduced cells were transferred to a 10 cm plate followed by selection with of puromycin for 3–6 days.
In vitro Lac-Phe production assay.
Cells were plated in 12-well plates at 70–80% confluence. The next day, cells were washed two times with PBS and incubated in 0.5 ml serum free media. After overnight incubation, 400 μl of media was removed and 20 μl of 1 M hydrochloride added to acidify the media and protonate Lac-Phe. 400 μl of ethyl acetate was added into each sample and vortexed for 30 seconds to extract Lac-Phe into the organic layer. 300 μl from the top layer was transferred to a new Eppendorf tube and dried down under a stream of nitrogen. The residue was re-suspended in 100 ul of an 80:20 mixture of acetonitrile/water. Cells were kept on ice to harvest the lysate. 150 μl of PBS was added into each well and the cells scraped into an Eppendorf tube. This step was repeated again to ensure all cells have been harvested. Cells were then centrifuged at 4 °C for 10 minutes at 2,000 xg and the supernatant removed to obtain the cell pellet. 100 μl of a 2:1:1 mixture of acetonitrile/methanol/water mixture was used to lyse the cells and precipitate large proteins. The mixture was centrifuged at 4 °C for 10 minutes at 15,000 rpm and the supernatant was transferred to a LC-MS vial.
Western blot analysis.
Cells were collected and lysed by sonication in RIPA buffer containing 1:100 HALT protease inhibitor. Cell lysates were centrifuged at 4 °C for 10 minutes at 13,000 rpm to remove residual cell debris. Protein concentrations of the supernatant were normalized using the Pierce BCA protein assay kit and combined with 4 x NuPAGE LDS Sample Buffer with 10 mM DTT. Samples were then boiled for 10 minutes at 95 °C. Prepared samples were run on a NuPAGE 4–12% Bis-Tris gel then transferred to nitrocellulose membranes. Blots were blocked for 30 minutes at room temperature in Odyssey blocking buffer. Primary antibodies (rabbit anti-CNDP2 and rabbit anti-Beta-Tubulin) were added to Odyssey blocking buffer at a ratio of 1:1000. Blots were incubated in the indicated primary antibodies overnight while shaking at 4 °C. The following day, blots were washed 3 times with PBS-T, 10 minutes each before staining with the secondary antibody for 1 hour at room temperature. The secondary antibody used was a goat anti-rabbit antibody diluted in blocking buffer to a ratio of 1:10,000. Following secondary antibody staining, the blot was washed 3 times with PBS-T before being imaged with the Odyssey CLx Imaging System.
Breeding and genotyping of CNDP2-KO mice.
CNDP2-KO and wild type animals were obtained from the International Mouse Phenotyping Consortium (IMPC) and generated via heterozygous breeding crosses. Genotyping was performed as follows: Tail clippings were obtained from littermates and boiled for 30 minutes at 95 °C in 100 μl of 50 mM NaOH to extract genomic DNA. The solution was neutralized by adding 21 μl of 0.5 M Tris (pH 7.2). PCR reactions were performed by using primers for either the CNDP2 WT allele (Forward: 5’-CAGATGGCTCGGAGATACCAC-3’, Reverse: 5’-TTCCCGCTCCACCAAGGTGAAG-3’) or CNDP2 KO allele (Forward: 5’-GCTCTGTAAGGGAAAGAGATGACCC-3’, Reverse: 5’-AATAGGACATACCCAGTTCTGTGAGG-3’). The Promega GoTaq master mix was used for the PCR reaction. Each 25 μl reaction consisted of 12.5 μl of the promega master mix (M7122), 2.5 μl of a 10 μM mixture of forward and reverse primers, 2 μl of genomic DNA, and 8 μl of ultrapure water. The thermocycling program on BioRad C1000 Touch Thermo Cycler began with an initial 30 seconds at 95°C, followed by cycles of 30 seconds at 98°C, 30 seconds at 58 °C, and 45 seconds at 72 °C, followed by 5 minutes at 72 °C and finally held at 4 °C. PCR reactions for WT primers consisted of 30 cycles while PCR reactions for KO primers consisted of 48 cycles. Samples were run on a 2% agarose gel with 0.2 mg/ml EtBr. WT alleles are expected to yield a PCR product 160 base pairs in size while KO alleles are expected to yield PCR products that are 440 base pairs in size.
Kaolin and water intake assays.
Mice were individually housed and allowed ad libitum access to kaolin pellets (research diets K50001) for 5 days prior to the start of the experiment. Mice were also fed ad libitum with high fat diet and had ad libitum access to water. On the day of the experiment, kaolin and food pellets were replaced with fresh pellets. Mice were then injected with either vehicle or Lac-Phe and kaolin, high fat diet, and water intake measured after 24 hours.
Leptin and acylated ghrelin measurements.
Plasma from obese mice at time 0 or 30 min after injection with 50 mg/kg Lac-Phe was used to measure leptin and acylated ghrelin levels. A mouse leptin ELISA kit (Crystal Chem, #90030) and a mouse acylated ghrelin EIA kit (Cayman, #10006307) was used according to manufacturer’s instructions.
Human exercise study- single bout of acute treadmill running.
This study (“Cohort 1”) was conducted by the Snyder Lab at Stanford University with a detailed description of the experiment model and subject details in reference #7. Briefly, 36 healthy research participants were enrolled and consented to participate in the exercise study approved by the Stanford University Institutional Review Board (IRB 23602). Participants arrived at the test facility having fasted overnight (10–12 hours) and underwent symptom-limited cardiopulmonary exercise (CPX) testing on ramp-treadmills. Protocols were individualized to the fitness level of each participant and participants were encouraged to exercise until full maximal exercise capacity which lasted between 8–12 minutes. Blood was collected intravenously from the upper forearm before exercise as well as 2 min, 15 min, 30 min, and 1 hr post-exercise. The blood plasma was isolated and analyzed on an untargeted metabolomics platform.
Research design and methods for human endurance, sprint, and resistance training.
Eight young healthy men were recruited to the study (“Cohort 2”). The participants were 26.5±3.7 years, normal weight (BMI 23.5±2.1 kg/m2), non-smokers and not participating in regular physical activity (≤ 1 session/week) with a fitness level at 42.6±4.2 ml/min/kg. Prior to participation in any experimental practice, subjects were given written and oral information regarding potential risk of participation. Informed content was obtained from all subjects, in accordance with the Declaration of Helsinki II. The study was approved by The Ethics Committee of the Capital Region of Denmark (Journal number: H-18051389). The subjects arrived at the test facilities in the morning (08:00 a.m.), after an overnight fast (10 hours fast). Body composition was measured by dual-energy x-ray absorptiometry (Lunar DPX-IQ DEXA Scanner, Lunar Corporation, WI, USA). Maximal oxygen uptake (VO2 peak) was measured with an incremental ramp test on a Monark Ergomedic 893E bicycle (Monark, Sweden), to evaluate training status. The test was comprised of 5 minutes at 100 W and 5 minutes at 150 W, followed by a 25 W increase per min until exhaustion. Expired air was collected during the test, using an online gas analyzer (CareFusion, MasterScreen-CPX, Germany). Prior to each trial, subjects were asked to refrain from strenuous physical activity for a minimum of 48 hours. The day before each trial, a standardized diet (60 E% carbohydrate, 25 E% fat, 15 E% protein) was given in weighted portions. Calculation of energy requirement was based on the WHO formula (“Human Energy Requirements: Report of a Joint FAO/ WHO/UNU Expert Consultation.,” 2005) and daily physical activity level (PAL). On the morning of the experimental days, the subjects arrived in the fasted state at 08:00 a.m. by car or public transportation to avoid redundant physical activity. A venflon catheter (BD VenflonTM Pro Safety, Helsingborg, Sweden) was inserted in an antecubital vein for blood sampling at rest, acutely after exercise (0), and during recovery from exercise (15, 60, 120 and 180 minutes) After centrifugation, plasma was pipetted into aliquots (200 μl) and stored at −80°C until further analysis. All subjects underwent three identical experimental trials, only separated by the exercise modalities performed which were: 1) an endurance exercise trial (END), 2) a sprint exercise trial (SPT) and 3) a resistance exercise trial (RES). The trials were performed in a randomized order, and each trial was separated by at least 10 days. Endurance exercise trial (END). The END trial consisted of 90 minutes of continuous cycling at 55 % VO2 peak. The load was established during preliminary testing, although VO2 measurements were conducted and evaluated during the trial, to ensure the estimated load elicited 55% VO2 peak, and to account for a potential drift in VO2 during exercise. In case of insufficient or excessive loading, adjustments were implemented. Sprint exercise trial (SPT). The SPT trial consisted of a 5-min warmup at 50 W, followed by three bouts of 30-s all-out sprint (Wingate tests) on an ergometer bike. Each Wingate test was interspersed by 4 min of active recovery on 5 W. Resistance exercise trial (RES). The RES trial was based on bilateral knee extension exercise. The trial was initiated by a warmup consisting of 3 sets of 10 repetitions with a load corresponding to 50% of the 10-RM load. Each of the warm-up sets were interspersed by 2 min of rest. Following the warm-up 6 sets of 10 repetitions were performed at a load corresponding to 10-RM with each set interspersed by 2 min of rest.
Statistics.
All data was expressed as mean ± SEM unless otherwise specified. A student’s two-sided t-test was used for pair-wise comparisons. Two-way ANOVA with repeated measures in one factor were used for time course data of repeated measurements, with post hoc Sidak’s multiple comparisons test. Unless otherwise specified, statistical significance was set as P < 0.05.
Extended Data
Extended Data Fig. 1. Additional metabolomic characterization of Lac-Phe and lactoyl amino acid dynamics in mouse and thoroughbred racehorse exercise.
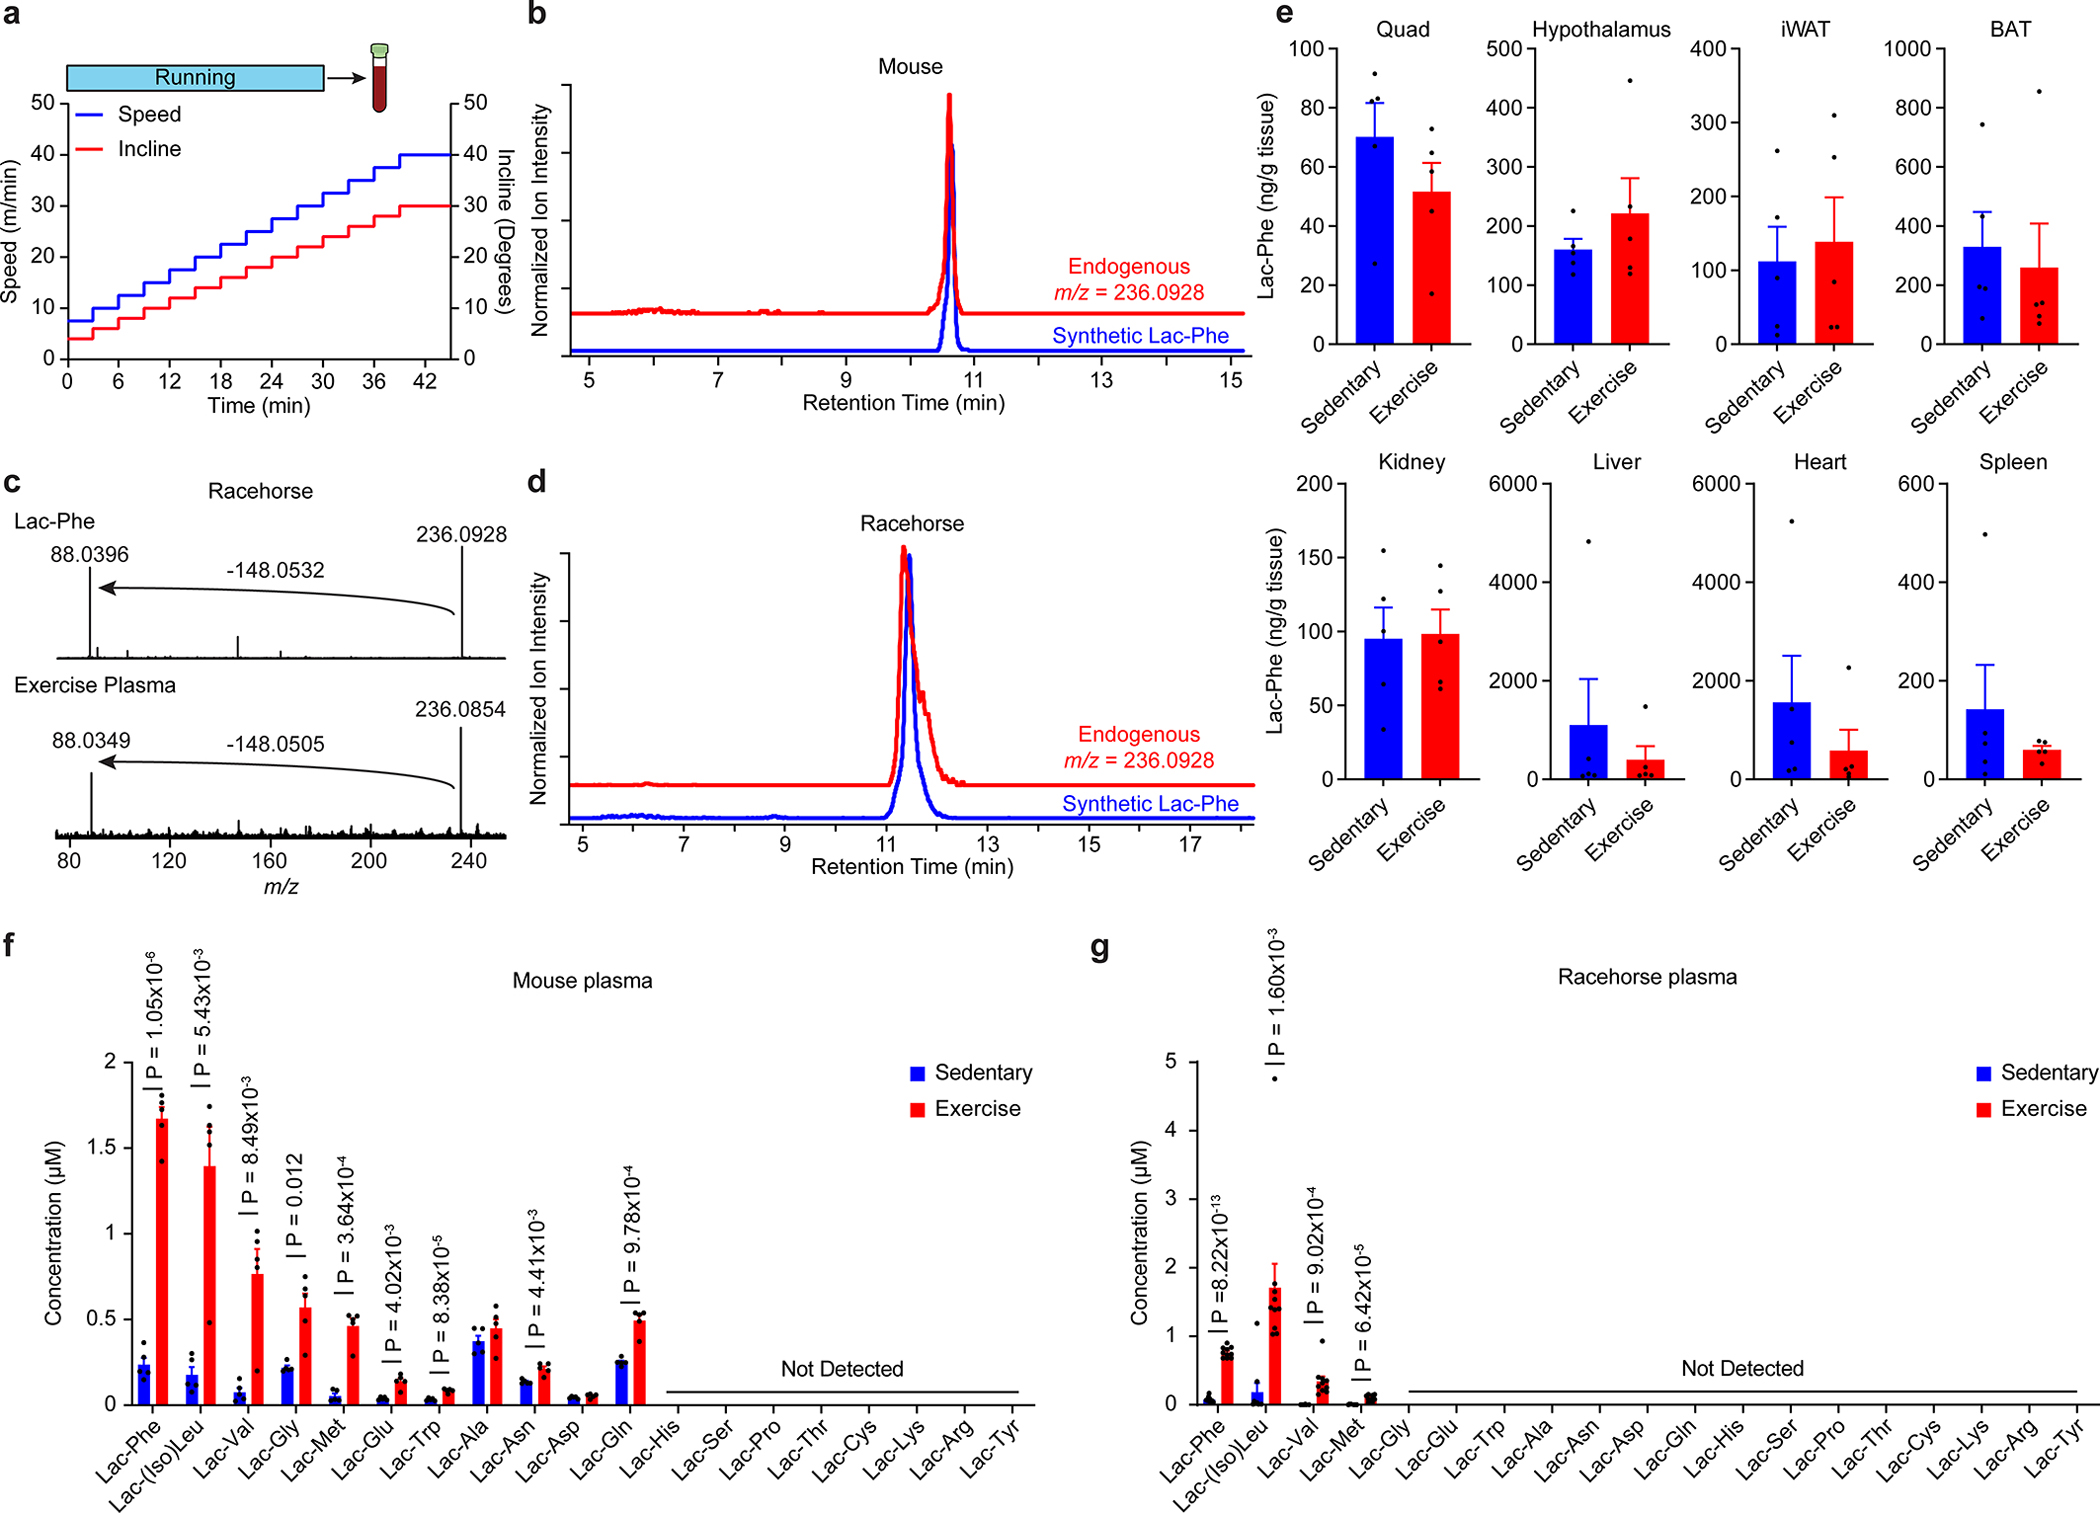
(a) Schematic of speed and incline in the acute running protocol for mice.
(b) Extracted ion chromatograms the endogenous m/z = 236.0928 peak in mouse plasma in comparison with a synthetic Lac-Phe standard.
(c,d) Fragmentation spectra (c) extracted ion chromatogram (d) of the the endogenous m/z = 236.0928 peak in horse plasma in comparison with a synthetic Lac-Phe standard.
(e) Quantitation of Lac-Phe levels in the indicated tissue from either sedentary mice (blue) or after a single bout of exhaustive running (red).
(f,g) Quantitation of the indicated lactoyl amino acid level in blood plasma from mouse (f) or racehorse (g).
For (e) and (f), N = 5/group; for (g), N=10/group. Data are shown as mean ± SEM.
All experiments were performed once. P-values were calculated by Student’s two-sided t-test.
Extended Data Fig. 2. Additional characterization and validation of CNDP2 protein in cells and in mice.
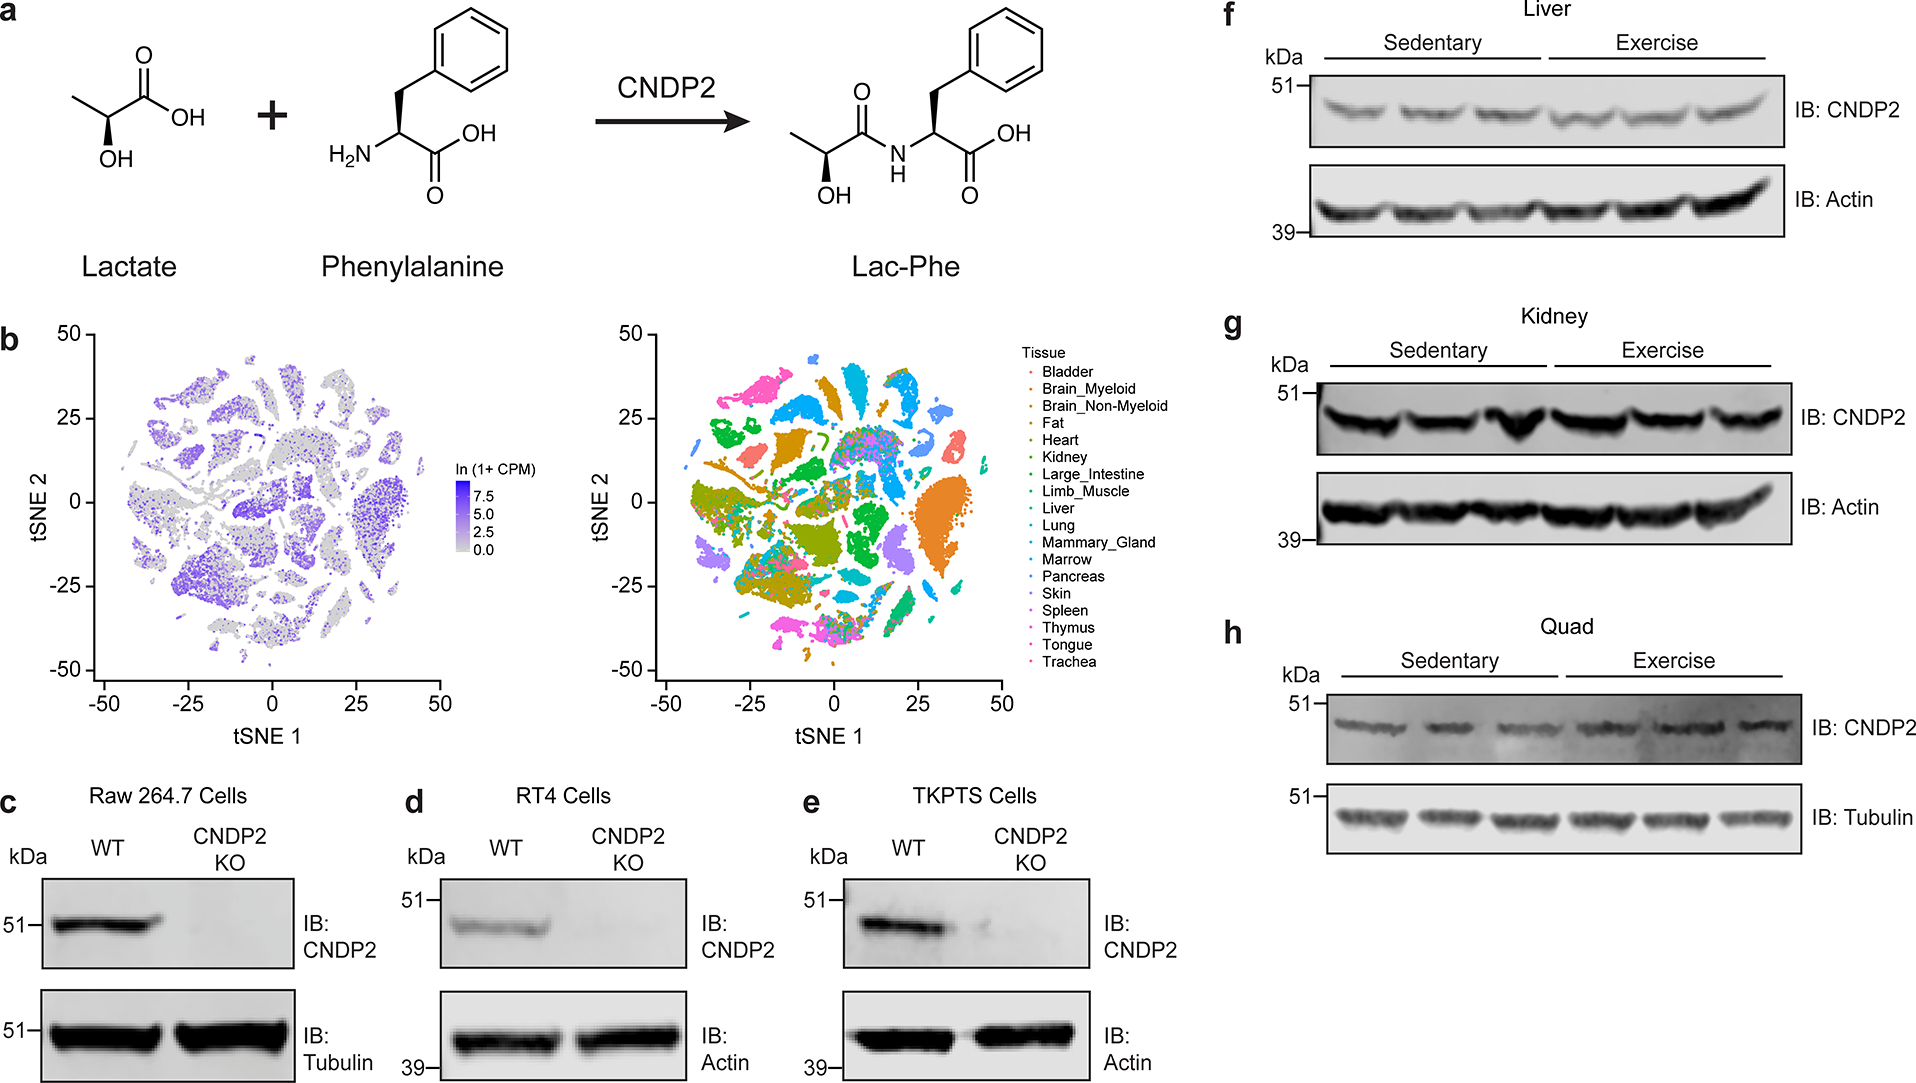
(a) Schematic of the chemical reaction catalyzed by CNDP2 to produce Lac-Phe.
(b) Cndp2 mRNA expression across tissues from Tabula Muris.
(c-e) Anti-CNDP2 (top) and anti-tubulin (bottom) Western blots in WT and CNDP2-KO RAW264.7 (c), RT4 (d), or TKPTS (e) cells.
(f-h) Anti-CNDP2 (top) and anti-actin (bottom) Western blots of liver (f), kidney (g), or quadraceps (h) harvested from either sedentary mice (left three lanes) or mice after a single bout of exhaustive exercise (right three lanes).
For gel source data, see Supplementary Figure 1.
For (c), experiments were performed twice. For (d-h), experiments were performed once.
Extended Data Fig. 3. Additional characterization of the effects of Lac-Phe administration to diet-induced obese mice.

(a,b) Phenotype associations of the single nucleotide polymorphisms rs373836366 (a) and rs780772968 (b) from the Type 2 Diabetes Knowledge Portal.
(c,d) Plasma Lac-Phe levels (c) and blood lactate levels (d) in plasma of mice following a single injection of Lac-Phe (50 mg/kg, IP).
(e-g) 12 hr oxygen consumption VO2 (e), carbon dioxide production VCO2 (f), and respiratory exchange ratio RER (g) of 22-week old DIO mice following a single injection of vehicle or Lac-Phe (50 mg/kg, IP).
(h-j) Food intake (h), kaolin intake (i), and water intake (j) in 21-week old DIO mice following a single injection of vehicle or Lac-Phe (50 mg/kg, IP).
(k,l) Plasma leptin (k) and acyl-ghrelin (l) levels in 17-week old DIO mice 30 min after a single injection of vehicle or Lac-Phe (50 mg/kg, IP).
For (c), (d), (k), and (l), N=3/group. For (e-j), N=7/group. Data are shown as means ± SEM.
All experiments were performed once. P-values were calculated by Student’s two-sided t-test.
Extended Data Fig. 4. Metabolic effects of Lac-Phe administration to chow-fed, lean mice.

(a) Lac-Phe levels in plasma of male lean mice (22–27 g) following a single injection of Lac-Phe (50 mg/kg, IP).
(b-f) 12 h food consumption (b), ambulatory activity (c), oxygen consumption VO2 (d), carbon dioxide production VCO2 (e), and respiratory exchange ratio RER (f) of chow fed lean mice following a single injection of Lac-Phe (50 mg/kg, IP).
(g) 24 h food intake in lean mice after a single injection of Lac-Phe at the indicated dose.
For (a), N=3/group. For (b-f), N=8/group. For (g), N=5/group. Data are shown as means ± SEM.
For (a-f), experiments were performed once. For (g), experiments were performed two times. P-values were calculated by Student’s two-sided t-test.
Extended Data Fig. 5. Metabolic effects of oral Lac-Phe administration to diet-induced obese mice.
(a,b) Change in body weight (a) and daily food intake (b) of 16-week diet-induced obese mice treated with Lac-Phe (50 mg/kg/day, PO).
N=5/group. Data are shown as means ± SEM.
Experiments were performed once.
Extended Data Fig. 6. Additional characterization of CNDP2-KO mice.
(a) Treadmill time until exhaustion for WT and CNDP2-KO (“KO”) mice.
(b-d) Plasma levels of the indicated lactoyl amino acid in WT or CNDP2-KO mice in the sedentary state or after a single bout of acute exhaustive running (“exercise”).
(e) Plasma levels of carnosine in sedentary WT or CNDP2-KO mice.
(f,g) Body weight (f) and cumulative daily food intake (g) of WT (blue) or CNDP2-KO (red) mice under high fat diet, sedentary conditions.
For (a), N=6 for WT and N=8 for CNDP2-KO; for (b-d), N=6/group; for (e), N=6 for WT and N=5 for CNDP2-KO; for (f,g), N=8 for WT and N=11 for CNDP2-KO. Data are shown as means ± SEM.
For (a-g), experiments were performed once. P-values for (a-e) were calculated by Student’s two-sided t-test.
Extended Data Fig. 7. Plasma Lac-Phe levels in WT and ABCC5-KO mice sedentary mice or after a single bout of treadmill running to exhaustion.

N=3/group. Data are shown as means ± SEM.
Experiments were performed once. P-values were calculated by Student’s two-sided t-test.
Extended Data Fig. 8. Additional characterization of plasma Lac-Phe levels in humans.

(a,b) Tandem MS fragmentation (a) and co-elution (b) of an authentic Lac-Phe standard and the endogenous m/z = 236.0928 mass from human plasma run on the Snyder laboratory untargeted metabolomics platform (see Methods).
(c) Time course of phenylalanine levels in blood before and after a single acute bout of treadmill running from the human acute treadmill exercise study (Cohort 1, N=36).
(d) Time course of lactate levels before and after sprint (red), resistance (blue), and endurance (light blue) exercise from the human crossover acute exercise study (Cohort 2, N=8).
For (c,d), data are shown as mean ± SEM, **p < 0.01, ***p < 0.001.
Experiments were performed once. P-values were calculated by two-way ANOVA with repeated measures.
Supplementary Material
Acknowledgements
We thank members of the Long, Xu, Snyder, Richter, and Svensson laboratories, as well as Lykke Sylow for helpful discussions. This work was supported by the NIH (DK124265 and DK130541 to JZL; DK113954, DK115761, DK117281, and DK120858 to YX; GM113854 to VLL; and AR072695 to KvdW), the Ono Pharma Foundation (research grant to JZL), BASF (research grant to JZL), the USDA (51000–064-01S to YX), the American Heart Association (20POST35120600 to YH), the Novo Nordisk Foundation (NNF17OC0027274 and NNF18OC00334072 to EAR), and PXE International (research grant to KvdW).
Footnotes
Competing interest declaration
The authors declare the following competing interests: a provisional patent application has been filed by Stanford University on lactoyl amino acids for the treatment of metabolic disease.
Reprints and permissions information is available at www.nature.com/reprints.
Data Availability Statement
All data generated or analyzed during this study are included in this published article and its supplementary information files.
References
- 1.Eriksson KF & Lindgärde F Prevention of Type 2 (non-insulin-dependent) diabetes mellitus by diet and physical exercise. Diabetologia 34, 891–898 (1991). [DOI] [PubMed] [Google Scholar]
- 2.Rejeski WJ et al. Lifestyle Change and Mobility in Obese Adults with Type 2 Diabetes. N. Engl. J. Med. 366, 1209–1217 (2012). [DOI] [PMC free article] [PubMed] [Google Scholar]
- 3.Stampfer MJ, Hu FB, Manson JE, Rimm EB & Willett WC Primary prevention of coronary heart disease in women through diet and lifestyle. N. Engl. J. Med. 343, 16–22 (2000). [DOI] [PubMed] [Google Scholar]
- 4.Helmrich SP, Ragland DR, Leung RW & Paffenbarger RS Physical activity and reduced occurrence of non-insulin-dependent diabetes mellitus. New English J. Med. 325, 147–152 (1991). [DOI] [PubMed] [Google Scholar]
- 5.Rawshani A et al. Risk Factors, Mortality, and Cardiovascular Outcomes in Patients with Type 2 Diabetes. N. Engl. J. Med. 379, 633–644 (2018). [DOI] [PubMed] [Google Scholar]
- 6.Sanford JA et al. Molecular Transducers of Physical Activity Consortium (MoTrPAC): Mapping the Dynamic Responses to Exercise. Cell 181, 1464–1474 (2020). [DOI] [PMC free article] [PubMed] [Google Scholar]
- 7.Contrepois K et al. Molecular Choreography of Acute Exercise. Cell 181, 1112–1130.e16 (2020). [DOI] [PMC free article] [PubMed] [Google Scholar]
- 8.Morville T, Sahl RE, Moritz T, Helge JW & Clemmensen C Plasma Metabolome Profiling of Resistance Exercise and Endurance Exercise in Humans. Cell Rep. 33, 108554 (2020). [DOI] [PubMed] [Google Scholar]
- 9.Lewis GD et al. Metabolic signatures of exercise in human plasma. Sci. Transl. Med. (2010) doi: 10.1126/scitranslmed.3001006. [DOI] [PMC free article] [PubMed] [Google Scholar]
- 10.Roberts LD et al. β-Aminoisobutyric acid induces browning of white fat and hepatic β-oxidation and is inversely correlated with cardiometabolic risk factors. Cell Metab. (2014) doi: 10.1016/j.cmet.2013.12.003. [DOI] [PMC free article] [PubMed] [Google Scholar]
- 11.Stanford KI et al. 12,13-diHOME: An Exercise-Induced Lipokine that Increases Skeletal Muscle Fatty Acid Uptake. Cell Metab. (2018) doi: 10.1016/j.cmet.2018.03.020. [DOI] [PMC free article] [PubMed] [Google Scholar]
- 12.Reddy A et al. pH-Gated Succinate Secretion Regulates Muscle Remodeling in Response to Exercise. Cell 183, 62–75.e17 (2020). [DOI] [PMC free article] [PubMed] [Google Scholar]
- 13.Yuan Y et al. Exercise-induced α-ketoglutaric acid stimulates muscle hypertrophy and fat loss through OXGR1-dependent adrenal activation. EMBO J. 39, e103304 (2020). [DOI] [PMC free article] [PubMed] [Google Scholar]
- 14.Klein AB et al. Pharmacological but not physiological GDF15 suppresses feeding and the motivation to exercise. Nat. Commun. 12, 2–10 (2021). [DOI] [PMC free article] [PubMed] [Google Scholar]
- 15.Sanford JA et al. Molecular Transducers of Physical Activity Consortium (MoTrPAC): Mapping the Dynamic Responses to Exercise. Cell 181, 1464–1474 (2020). [DOI] [PMC free article] [PubMed] [Google Scholar]
- 16.Green HJ & Fraser IG Differential effects of exercise intensity on serum uric acid concentration. Med. Sci. Sports Exerc. (1988) doi: 10.1249/00005768-198802000-00008. [DOI] [PubMed] [Google Scholar]
- 17.Schranner D, Kastenmüller G, Schönfelder M, Römisch-Margl W & Wackerhage H Metabolite Concentration Changes in Humans After a Bout of Exercise: a Systematic Review of Exercise Metabolomics Studies. Sport. Med. - Open 6, (2020). [DOI] [PMC free article] [PubMed] [Google Scholar]
- 18.Gaffney B & Cunningham EP Estimation of genetic trend in racing performance of thoroughbred horses. Nature 332, 722–724 (1988). [DOI] [PubMed] [Google Scholar]
- 19.Hagenfeldt L & Naglo AS New conjugated urinary metabolites in intermediate type maple syrup urine disease. Clin. Chim. Acta 169, 77–83 (1987). [DOI] [PubMed] [Google Scholar]
- 20.Bottesini C, Tedeschi T, Dossena A & Sforza S Enzymatic production and degradation of cheese-derived non-proteolytic aminoacyl derivatives. Amino Acids 46, 441–447 (2014). [DOI] [PubMed] [Google Scholar]
- 21.Sgarbi E et al. Microbial origin of non proteolytic aminoacyl derivatives in long ripened cheeses. Food Microbiol. 35, 116–120 (2013). [DOI] [PubMed] [Google Scholar]
- 22.Jansen RS et al. N -lactoyl-amino acids are ubiquitous metabolites that originate from CNDP2-mediated reverse proteolysis of lactate and amino acids. Proc. Natl. Acad. Sci. (2015) doi: 10.1073/pnas.1424638112. [DOI] [PMC free article] [PubMed] [Google Scholar]
- 23.Sharma R et al. Circulating markers of NADH-reductive stress correlate with mitochondrial disease severity. J. Clin. Invest. 131, (2021). [DOI] [PMC free article] [PubMed] [Google Scholar]
- 24.The Tabula Muris Consortium. Single-cell transcriptomics of 20 mouse organs creates a Tabula Muris. Nature 562, 367–372 (2018). [DOI] [PMC free article] [PubMed] [Google Scholar]
- 25.Locke AE et al. Genetic studies of body mass index yield new insights for obesity biology. Nature (2015) doi: 10.1038/nature14177. [DOI] [PMC free article] [PubMed] [Google Scholar]
- 26.Ringholm S et al. PGC-1α Is Required for Exercise- and Exercise Training-Induced UCP1 Up-Regulation in Mouse White Adipose Tissue. PLoS ONE vol. 8 (2013). [DOI] [PMC free article] [PubMed] [Google Scholar]
- 27.Kim YJ, Kim HJ, Lee WJ & Seong JK A comparison of the metabolic effects of treadmill and wheel running exercise in mouse model. Lab. Anim. Res. 36, 1–8 (2020). [DOI] [PMC free article] [PubMed] [Google Scholar]
Methods References
- 28.De Wolf CJF et al. cGMP transport by vesicles from human and mouse erythrocytes. FEBS J. 274, 439–450 (2007). [DOI] [PubMed] [Google Scholar]
- 29.Smith CA et al. XCMS: processing mass spectrometry data for metabolite profiling using nonlinear peak alignment, matching, and identification. Anal. Chem. 78, 779–787 (2006). [DOI] [PubMed] [Google Scholar]
- 30.Agudelo LZ et al. Skeletal muscle PGC-1α1 modulates kynurenine metabolism and mediates resilience to stress-induced depression. Cell 159, 33–45 (2014). [DOI] [PubMed] [Google Scholar]
- 31.Coxon JP et al. GABA concentration in sensorimotor cortex following high-intensity exercise and relationship to lactate levels. J. Physiol. 596, 691–702 (2018). [DOI] [PMC free article] [PubMed] [Google Scholar]
Associated Data
This section collects any data citations, data availability statements, or supplementary materials included in this article.
Supplementary Materials
Data Availability Statement
All data generated or analyzed during this study are included in this published article and its supplementary information files.