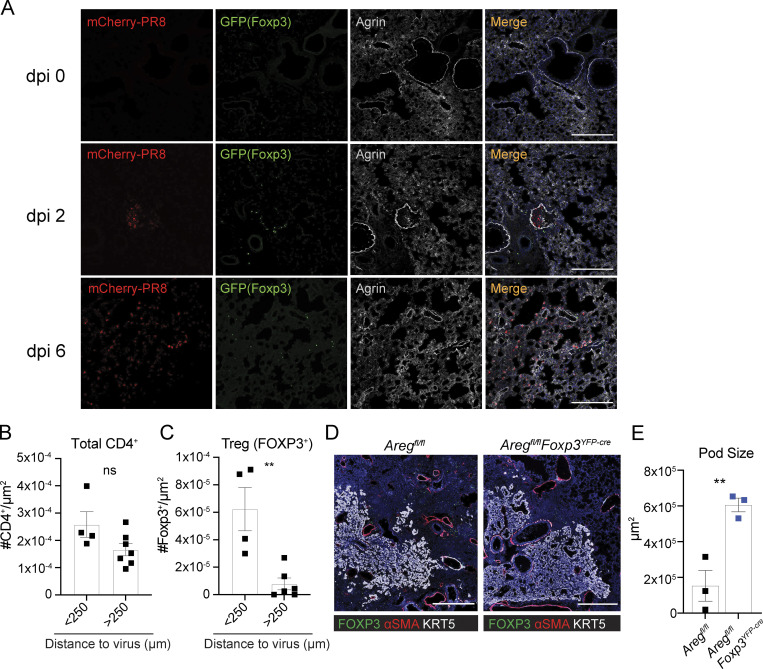
Figure 1.
Treg cells infiltrate to sites of active viral infection and influence epithelial repair. (A) Foxp3gfp mice intranasally infected with PR8/H1N1-mCherry or PBS (mock) were analyzed by immunofluorescence imaging to assess the proximity of Treg cells (green) to PR8-mCherry virus (red) in relation to the secreted ECM proteoglycan, Agrin, at the indicated dpi. Scale bar = 200 µm. (B and C) Quantification of total CD4+ T cells (B) or Foxp3+ Treg cells (C) located within less than or greater than 250 μm from PR8/H1N1-mCherry virus infected regions at dpi 4. (D) Immunofluorescence imaging of KRT5+ pods (white), αSMA+ cells (red), and FOXP3+ Treg cells in Aregfl/fl (control) or Aregfl/flFoxp3YFP-cre mice at 17 dpi with PR8/H1N1. Scale bar = 400 μm. (E) Quantification of the total area of KRT5+ pods in whole mouse lung sections; n = 3 mice/group. Representative data from one of two independent experiments shown. On vertical bar plots, each point represents a biologic replicate and bars show mean ± SEM. Data were analyzed by two-tailed unpaired Student’s t test (** P < 0.01).

