Figure 2.
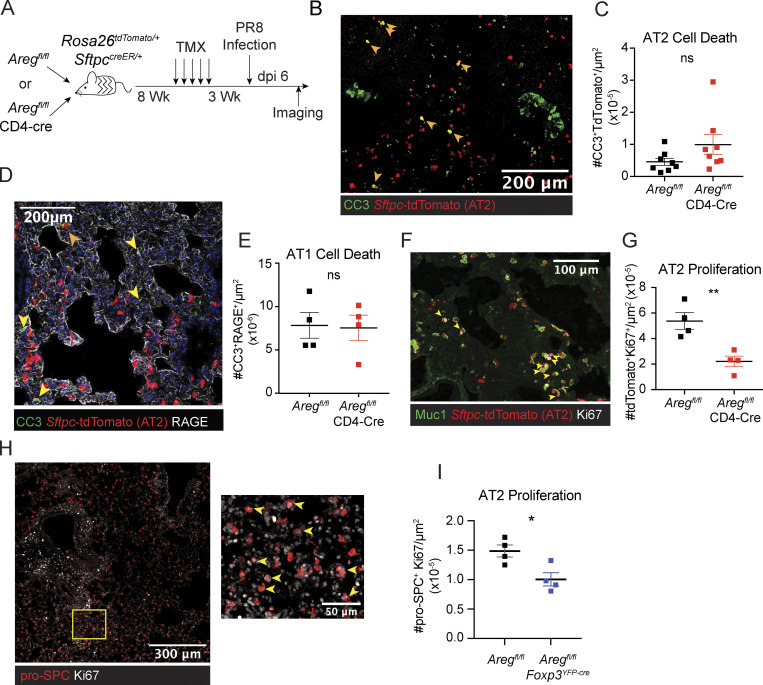
Treg cell– and T cell–specific ablation of Areg leads to defects in AT2 proliferation. (A–E) (A) Schematic of bone marrow chimeras generated from lethally irradiated SPCcreRosa2tdTomato/+ hosts reconstituted with bone marrow from Aregfl/fl or Aregfl/flCD4-Cre littermate animals. Following reconstitution, AT2 labeling was induced by oral tamoxifen (TMX) administration and animals were subsequently infected with PR8/H1N1. (B–E) Imaging at dpi 6 of influenza-infected lungs described in A. Each point on image quantification graphs represents one biologic replicate. Two independent experiments were performed using this bone marrow chimera system. (B and C) Representative image and quantification of apoptotic cell death analyzed by CC3 staining of tdTomato+ AT2. Filled orange arrowheads indicate apoptotic AT2. Pooled data from two independent experiments are shown. (D and E) AT1 apoptosis quantified by CC3 staining of RAGE+ cells (AT1) indicated by filled yellow arrowheads. (F) Immunofluorescent staining of lungs from bone marrow chimeras harvested at dpi 6, with AT2 proliferation measured by Ki67 immunostaining (white) of Sftpc-tdTomato+ cells, with Muc1 staining also used to guide determination of AT2. (G) Quantification of tdTomato+Ki67+ cells per μm2. (H) Imaging of AT2 proliferation in lungs of Aregfl/fl (wildtype) at dpi 6 by Ki67 (white) of pro-SPC+ cells. Zoomed image of yellow box in left image is shown in right image highlighting Ki67+ pro-SPC+ proliferating AT2. (I) Quantification of AT2 proliferation in Aregfl/flFoxp3YFP-cre mice and Aregfl/fl littermate controls as in shown in H at dpi 6. Representative data from one of two independent experiments shown. On vertical bar plots, each point represents a biologic replicate and bars show mean ± SEM. Data were analyzed by two-tailed unpaired Student’s t test (* P < 0.05, ** P < 0.01).

