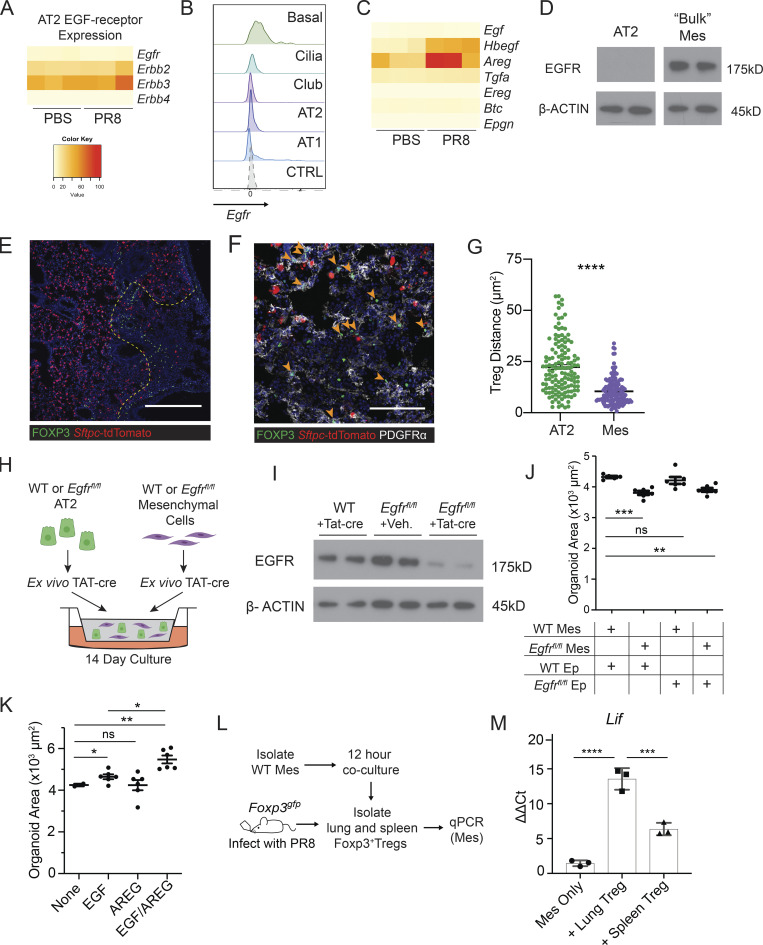
Figure 4.
EGFR activation on mesenchymal cells stimulates alveolar growth in vitro. (A) Heatmap of EGFR-family receptor expression by RNA-Seq of FACS-sorted AT2 from PBS-treated and PR8/H1N1-infected mice at dpi 7; n = 4 animals per group. (B) RNA flow cytometry of Egfr expression by epithelial cell type analyzed by RNA PrimeFlow. Control probe = Dapb. (C) Heatmap of EGFR ligand expression determined by RNA sequencing of AT2 from mock-treated (PBS) and PR8/H1N1-infected wildtype animals; n = 4 animals per group. (D) Immunoblot for EGFR protein expression in wildtype mesenchymal and epithelial cells isolated from C57BL/6 mice and cultured overnight prior to protein extraction. Protein input normalized by Bradford assay and validated by staining for β-actin (bottom panels). Representative data from one of two independent experiments shown. (E and F) Immunofluorescence imaging of lung tissue sections from tamoxifen-treated SPCcreER/+Rosa26tdTomato mice infected with PR8/H1N1 influenza at dpi 6. (E) Treg cell (FOXP3+, green) distribution in relation to AT2 (red) or (F) PDGFRα+ mesenchymal cells (Mes, white). Scale bar in E = 400 μm; scale bar in F = 100 μm; filled orange arrowheads indicate Treg cells. (G) Quantification of Treg:AT2 and Treg:Mes distances calculated by K-nearest neighbor analysis. At least four damaged areas were analyzed in each of n = 3 mice. Data represented as mean ± SEM; statistical significance evaluated by two-tailed unpaired Student’s t test (**** P < 0.0001). (H) Alveolar organoid culture setup of lung epithelial and mesenchymal cells isolated from C57BL/6 or Egfrfl/fl mice cultured for 14 d following treatment with TAT-cre to induce Egfr deletion. (I) Immunoblot for deletion of EGFR following in vitro treatment with TAT-cre in Egfrfl/fl lung mesenchymal cells with wildtype mesenchyme and vehicle controls. Protein input normalized by Bradford assay and validated by staining for β-actin (bottom panels). Representative data from one of three independent experiments shown. (J) Quantification of the average area of all organoids ≥1000 µm2 with mesenchymal EGFR deletion, epithelial EGFR deletion, both, or neither (control). Data represented as mean ± SEM. Experiment performed five times (mesenchymal deletion conditions alone: three experiments; epithelial deletion conditions included alongside mesenchymal conditions: two experiments), with normalized data from the latter two experiments represented on graphs. Statistical significance evaluated by one-way ANOVA (** P < 0.01, *** P < 0.001). (K) Organoids generated from co-culture of AT2 and lung mesenchymal cells isolated from C57BL/6 mice grown with or without the addition of rmAREG (100 ng/ml), rmEGF (25 ng/ml), or both, for 14–16 d. Quantification of the average area of all organoids ≥1000 µm2. Data represented as mean ± SEM; statistical significance evaluated by one-way ANOVA (* P < 0.05, ** P < 0.01). Experiment performed three times, with normalized data from all experiments shown. (L and M) In vitro setup of Treg cells co-cultured with isolated lung mesenchymal cells for 12 h at a 1:2 (Treg:Mes) ratio (L) and transcriptional analysis of adherent mesenchymal cells for EGFR activation (M) assessed by qPCR for Lif expression normalized to housekeeping (Tbp). Data represented as mean ± SEM; n = 3 wells/group. Representative data from one of three independent experiments shown; statistical significance evaluated by one-way ANOVA (*** P < 0.001, **** P < 0.0001). Source data are available for this figure: SourceData F4.

