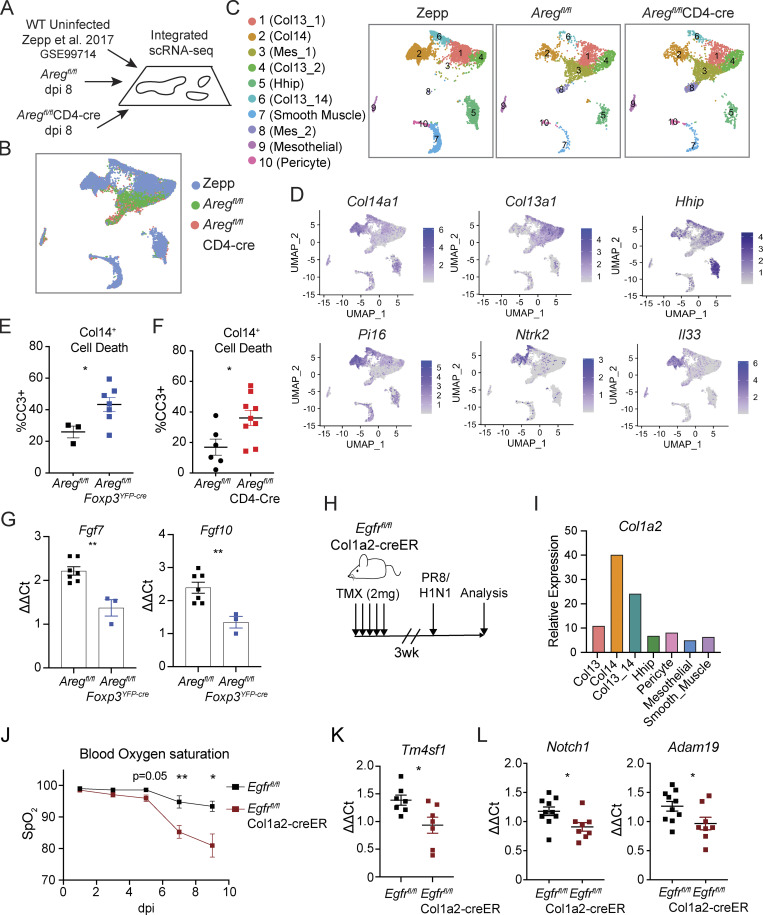
Figure 7.
Treg-derived Areg promotes Col14+ cell survival and growth factor production during infection. (A–D) Integration of previously published scRNA-Seq data from C57BL/6 lung mesenchymal cells (GSE99714) with data from lung mesenchymal cells isolated from Aregfl/flCD4-Cre and Aregfl/fl littermate control mice at dpi 8 following influenza virus infection. (B) UMAP rendering of integrated datasets described in A. (C) Overlay of cell clusters within UMAP projection comparing mesenchymal subsets at steady state (Zepp), and at 8 dpi of Aregfl/flCD4-Cre and Aregfl/fl littermate control mice with PR8/H1N1. (D) Feature plots of identity genes for Col14+ mesenchymal cells. (E and F) Apoptosis of Col14+ lung mesenchymal cells, as quantified by flow cytometric analysis of CC3 staining at dpi 6 in (E) Aregfl/flFoxp3YFP-cre and corresponding Aregfl/fl littermate control and (F) Aregfl/flCD4-Cre and corresponding Aregfl/fl littermate control mice. Representative data from one of three independent experiments shown, depicted as mean ± SEM, statistical significance evaluated by two-tailed unpaired Student’s t test (* P <0.05). (G) Expression of Fgf7 and Fgf10 in Col14+ mesenchymal cells isolated from Aregfl/flFoxp3YFP-cre in comparison to Aregfl/fl littermate controls at dpi 6 by qPCR. Data are normalized to Tbp and represented as mean ± SEM, statistical significance evaluated by two-tailed unpaired Student’s t test (** P <0.01). Representative data from one of two independent experiments shown. (H) 8-wk-old Egfrfl/flCol1a2-creER and Egfrfl/fl littermate control mice were treated with five consecutive doses of tamoxifen (TMX) followed by 3-wk chase period prior to infection with PR8/H1N1. (I) Col1a2 expression by mesenchymal cell clusters identified within Zepp naive lung scRNA-Seq dataset. (J) Blood oxygen saturation measured by MouseOx pulse oximeter during influenza infection of Egfrfl/flCol1a2-creER mice and Egfrfl/fl controls at dpi 1, 3, 5, 7, and 9. Representative data from one of two independent experiments shown, statistical significance evaluated at each time point by two-tailed unpaired Student’s t test (* P <0.05, ** P <0.01). (K) AECint from Egfrfl/flCol1a2-creER and Egfrfl/fl littermate control mice isolated by FACS at dpi 5 for transcriptional analysis of Tm4sf1 normalized to Tbp. Representative data from one of two independent experiments shown, depicted as mean ± SEM. (L) Expression of Notch1 and Adam19 in AECint isolated from Egfrfl/flCol1a2-creER and Egfrfl/fl normalized to Tbp assessed by qPCR at dpi 4. Representative data from one of two independent experiments shown, depicted as mean ± SEM. Statistical significance for K and L evaluated by two-tailed unpaired Student’s t test (* P <0.05).

