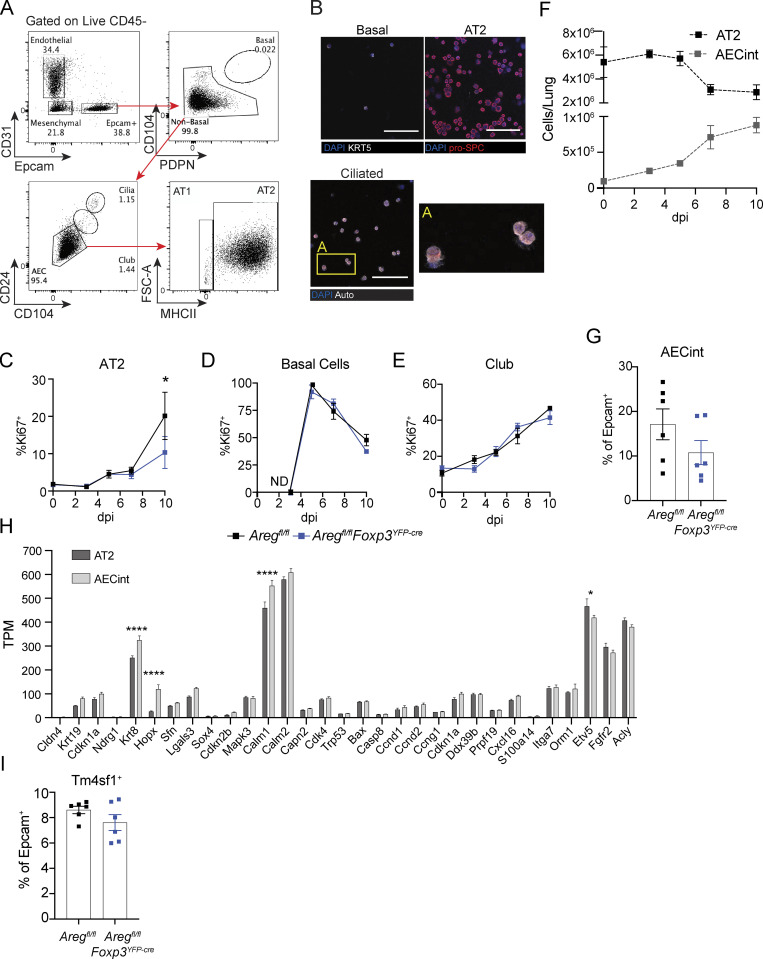
Figure S3.
AT2 have reduced proliferation in the absence of Treg cell–derived Areg, and arising AECint are comprised of transitional AEC populations that share features of AT2 and AT1. (A) Gating strategy of live lung epithelial cells following agarose-prep isolation from lungs of mice at dpi 3 with PR8/H1N1-mCherry. (B) Cytospin analysis of sorted lung basal cell, AT2, and ciliated cells stained for pro-SPC (red) or KRT5. Box A shows a zoomed image of ciliated cells. Scale bar = 100 μm. (C–E) Proliferation of lung progenitor epithelial cells in Aregfl/flFoxp3YFP-cre and Aregfl/fl controls during influenza infection at dpi 0, 3, 5, 7, and 10 assessed by flow cytometry for Ki67 intracellular staining; n = 4 mice per group per time point, representative data from one of at least two independent experiments per time point shown; statistical significance evaluated by two-tailed unpaired Student’s t test at each time point (* P <0.05). (F) Kinetic assessment of the number of wildtype AT2 and AECint during influenza A virus infection determined by flow cytometry. (G) Flow cytometric analysis of AECs isolated from Aregfl/flFoxp3YFP-cre and Aregfl/fl littermate control mice at dpi 6 influenza A virus quantifying the frequency of AECint of total Epcam+ cells; n = 6 animals per group, representative data from one of two independent experiments shown. (H) Bulk RNA-Seq of AT2 and AECint at dpi 7 of influenza infection isolated from four wildtype animals. Gene expression shown in transcripts per million (TPM) of genes associated with damage-associated transitional progenitor cells. Data represented as mean ± SEM; statistical significance evaluated by two-way ANOVA (* P < 0.05, **** P < 0.0001). (I) Flow cytometric analysis of AECs at dpi 6 of influenza infection as in G. Frequency of TM4SF1+ AECs within total Epcam+ cells.

