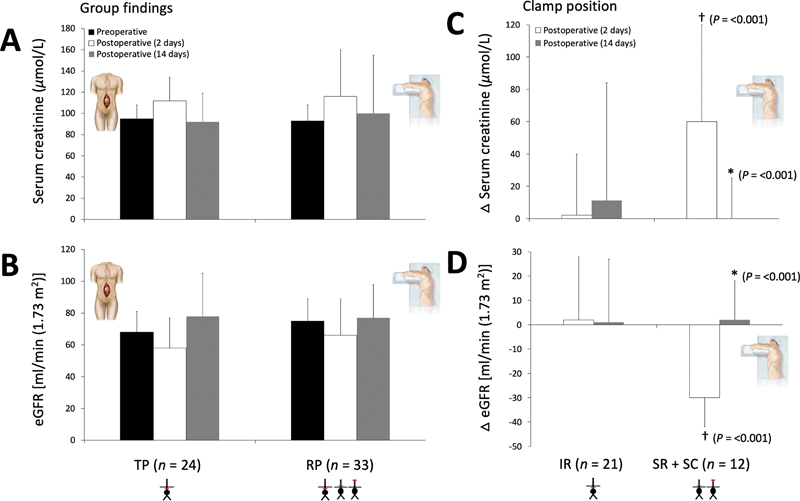
Fig. 1.

Renal function following transperitoneal (TP) and retroperitoneal (RP) abdominal aortic aneurysm repair. Values are mean ± standard deviation (SD). Group changes ( A , B ) further differentiated according to clamp position in RP patients ( C , D ). Δ ( C , D ), reflects difference relative to preoperative values. eGFR, estimated glomerular filtration rate; IR, infrarenal; SR, suprarenal; SC, supraceliac. ( A ) Please note clamp position(s) and see “Methods” (Surgical Approach) for clarification. Group effect: p = 0.576; time effect: p = 0.001; group × time: p = 0.680. ( B ) Group effect: p = 0.263; time effect: p = < 0.001; group × time: p = 0.336. ( C ) Group effect: p = 0.172; time effect: p = < 0.001; group × time: p = < 0.001. ( D ) Group effect: p = 0.053; time effect: p = < 0.001; group × time: p = < 0.001. *Within-group difference as a function of postoperative period; †between-group difference as a function of postoperative period. p -Values obtained using two-way repeated-measures analyses of variance (group: TP vs. RP or clamp: IR vs. SR + SC × time: pre-/postoperative period) followed by paired/independent samples t -tests following an interaction.
