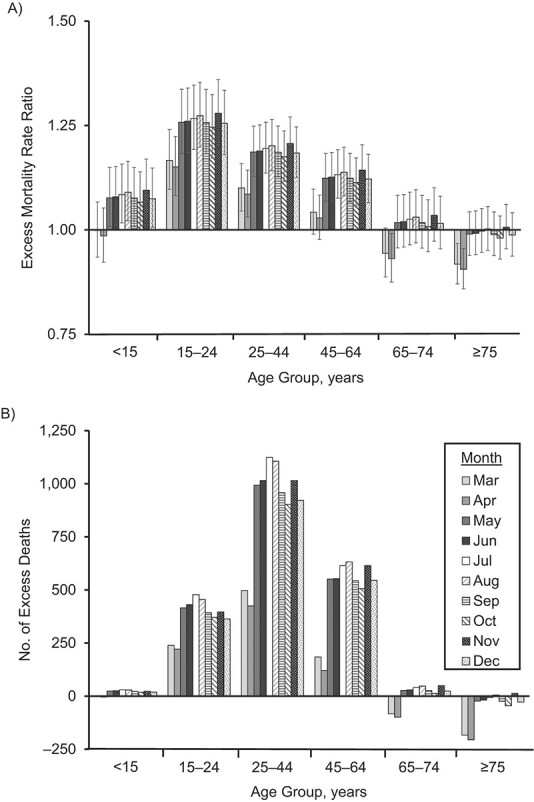
Figure 3.

Excess mortality from external causes by age group during March–December 2020 in US males. A) Rate ratios; B) number of excess deaths. These estimates are based on the regression models in Web Table 2. The bars on the graph of excess mortality rate ratios represent the 95% confidence intervals. Negative values are not shown in (B).
