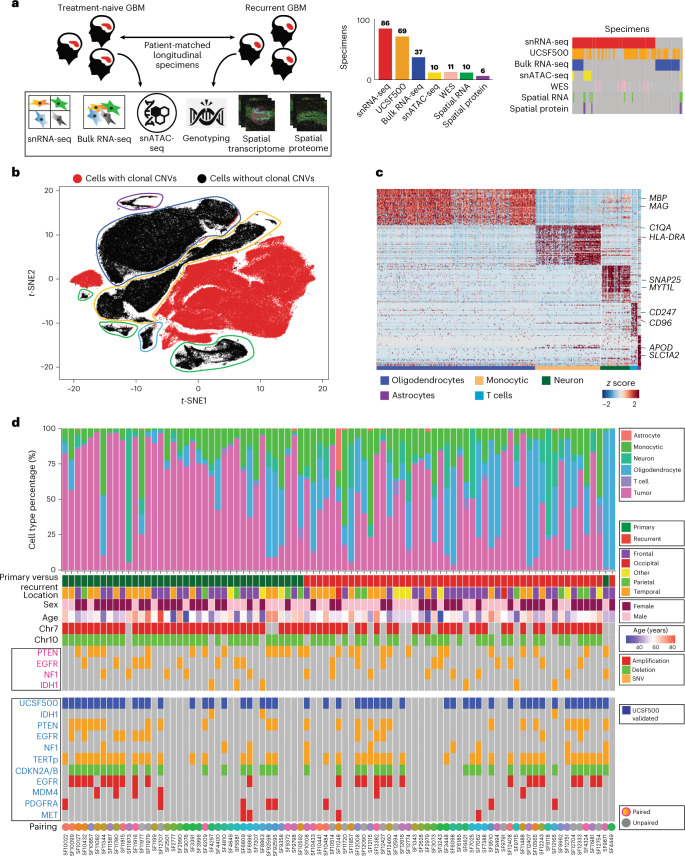
Fig. 1. A single-cell RNA atlas of human glioblastoma through recurrence.
a, An overview of genomics studies on paired longitudinal GBM specimens. b, A t-distributed stochastic neighbor embedding (t-SNE) of the first ten principal components of snRNA-seq data. Cells with CNVs are annotated. n = 86 tumors were used (b–d). c, A hierarchical clustering of cells without CNVs, with several cluster-specific genes highlighted. d, A summary of sample cellular composition, genotype and demographics. Top: cellular composition inferred from snRNA-seq. Middle: patient and sample annotations, with genotype inferred from snRNA-seq. Bottom: genotypes inferred from the UCSF500 clinical DNA-amplicon-sequencing assay performed on adjacent tissue and controlled by sequencing a patient-matched blood specimen.

