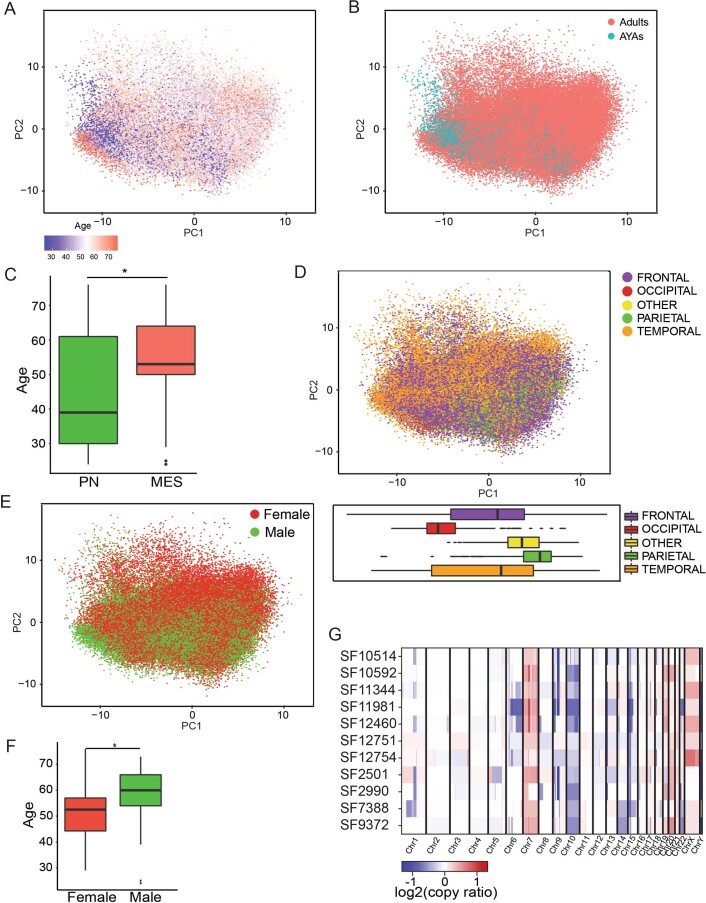
Extended Data Fig. 2. Clinical and genomic correlates of expression.
a) A PCA of GBM neoplastic cells from snRNA-seq with patient age annotated, N = 78,415 cells. b) Annotation of adult vs. adolescent and young-adult status, N = 78,415 cells. c) A comparison of patient age between snRNA-seq neoplastic cells classified as PN vs. MES, N = 72 tumors. *- one-sided Wilcoxon rank-sum test p = 0.0161. Boxplots in panels C and E-F are defined as follows, lower/upper whiskers: smallest/largest observation ≥/≤ the lower/upper hinge −/+ 1.5 times the interquartile range (IQR); lower/upper hinge: 25th/75th percentile; center: 50th percentile. d) A PCA of GBM neoplastic cells from snRNA-seq with location of resection annotated. The distributions along principal component one of cells by location are shown as boxplots below, N = 78,415 cells. e) As above, but with sex annotated, N = 72 tumors. f) A comparison of patient ages between the male and female sex, N = 72 tumors. *- one-sided Wilcoxon rank-sum test p = 0.0389. g) CNV calls from exome-seq for select specimens.

