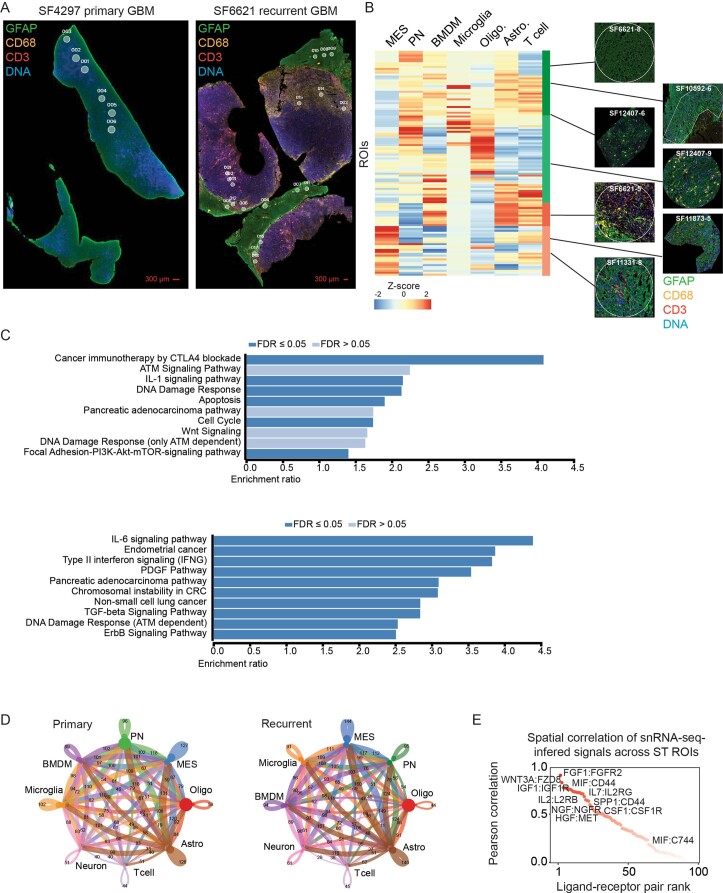
Extended Data Fig. 6. Pathway and network analysis of paracrine signaling from ST data.
a) Representative IF images visualizing glia, innate and adaptive immune cells, performed on patient-matched primary (left) and recurrent (right) FFPE GBM specimens (from 120 ROIs from 10 slides assayed). ROIs used for in ST profiling of this specimen are annotated. b) A heatmap showing the relative contributions of neoplastic, glial and immune cell types inferred by deconvolving ST data using snRNA-seq signatures. IF of typical ROIs corresponding to the associated cell composition signatures are annotated on the right. c) (Top) a pathway enrichment analysis via WebGestalt, using Wikipathway.org pathway annotations, for genes in the first two clusters of the ST data shown in Fig. 6c. (Bottom) as above, but for the third and fourth clusters. d) A summary of inferred intercellular paracrine signals, based on snRNA-seq data, between different GBM cell types and compared between primary and recurrent GBM. The numbers annotated for each interaction denote the number of genes involved in the given signaling pathway. d) Pearson correlations across ST ROIs and samples for receptor-agonist gene pairs inferred from snRNA-seq data.

