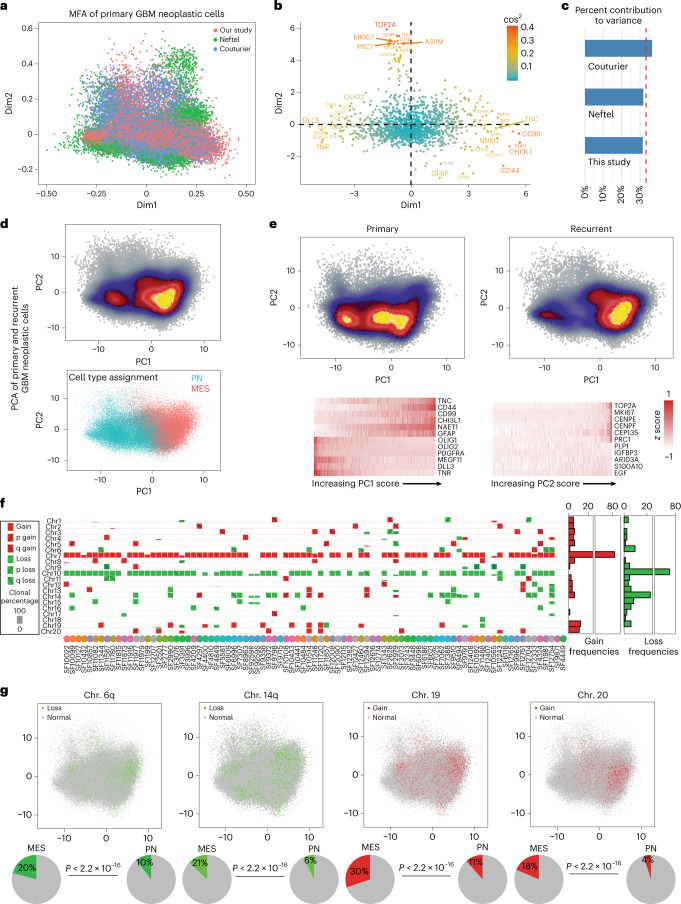
Fig. 2. A meta-analysis of public and in-house data identifies the proneural-to-mesenchymal axis as the primary source of phenotypic variation in glioblastoma neoplastic cells and genetic correlates.
a–c, MFA of primary GBM neoplastic cells from the scRNA-seq data of Neftel et al.9 (n = 5,588 cells), Couturier et al.7 (n = 17,884 cells) and snRNA-seq from our study (n = 34,582 cells). Cell loadings (a), gene scores (b) and an analysis of each dataset’s contribution to variance explained (c). d, Top: PCA of all GBM neoplastic cells from our study from longitudinal specimens. n = 78,415 cells from 62 paired tumors. Bottom: PN and MES cell-type assignments. e, Separate plots of the cells from primary GBMs (left) and recurrent cases (right). Expression values of top-loading genes in single cells are shown below. Cells are sorted according to position along the axis labeled. n = 78,415 cells. f, Summary of megabase-scale CNVs detected in the snRNA-seq data, indicating the presence of CNVs in individual samples, their type and cellular frequency. n = 86 tumors. g, The distribution of Chr6−, Chr14−, Chr19+ and Chr20+ CNVs in single cells in PCA from d. Bottom: percentages of PN and MES cells that have these genotypes and the associated one-sided Fisher’s P value indicating the probability that this association occurs by chance. n = 78,415 cells.

