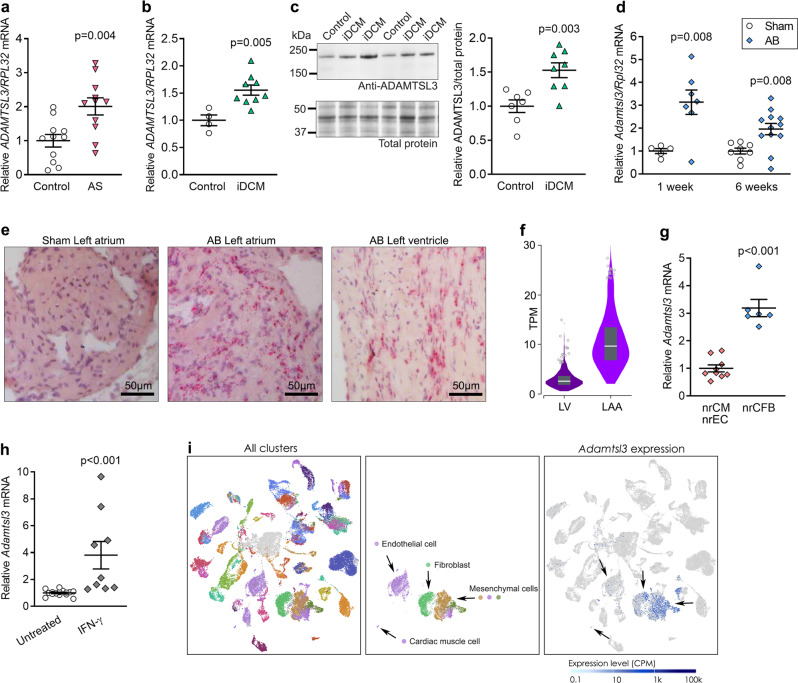
Fig. 1. ADAMTSL3 is upregulated in patients with heart failure and in wild-type mice with left ventricular pressure overload, and is produced by cardiac fibroblasts.
a-b ADAMTSL3/RPL32 mRNA levels in left ventricular (LV) biopsies from patients with a aortic stenosis (AS, n = 11) and b ischemic dilated cardiomyopathy (iDCM, n = 9) vs. respective controls. c Western blot and quantification of ADAMTSL3 protein/total protein levels in LVs of patients with iDCM (n = 8) vs. controls (n = 7). d Adamtsl3/Rpl32 mRNA levels in LVs of wild-type (WT) mice 1 and 6 weeks after aortic banding (AB) or sham surgery (n = 5 sham and n = 7 AB at 1 week, n = 8 sham and n = 12 AB at 6 weeks). e In situ hybridization of Adamtsl3 mRNA (red staining) in the left atrium of AB and sham-operated mice, and in the LV wall of AB mice, 4 weeks post-AB, with hematoxylin nuclear counterstain (purple). f RNA sequencing data from the Genotype-Tissue Expression (GTEx) project portal. In GTEx, a total of 17382 samples across 54 non-diseased tissues, from 948 deceased human organ donors, represents a control population. Donors are 20-70 years old, 33% female, 85% White and 13% African-American. ADAMTSL3 expression is shown as transcripts per kilobase million (TPM), in LV (n = 432, median TPM = 2.54) and left atrial appendage (LAA, n = 429, median TPM = 9.66). g mRNA levels of Adamtsl3 in neonatal rat cardiac fibroblasts (nrCFB) and cardiomyocytes (nrCM), with presence of endothelial cells (nrEC), isolated from 1-3 day old rat hearts (n = 3 isolations of n = 60 hearts, with n = 3 culture replicates per isolation). h mRNA levels of Adamtsl3 in untreated primary nrCFBs, and nrCFBs stimulated with 5 ng IFN-γ. Data are scatterplots (a–d, g–h) or violin plot f with mean ± SEM. Statistical analyses was performed using the Student’s t-test vs. respective controls (a–d, g–h). i Data from the EMBL-EBI Single Cell Expression Atlas. All clusters with 82 cell types from 20 mouse tissues (n = 3 female and n = 4 male 10-15 week old mice)22, and extraction of endothelial cells, cardiac muscle cells, fibroblasts and mesenchymal cells (fibroblast progenitors) are shown, and the clustering of Adamtsl3 expression (blue dots). Scale bar is counts per million (CPM) reads mapped.

