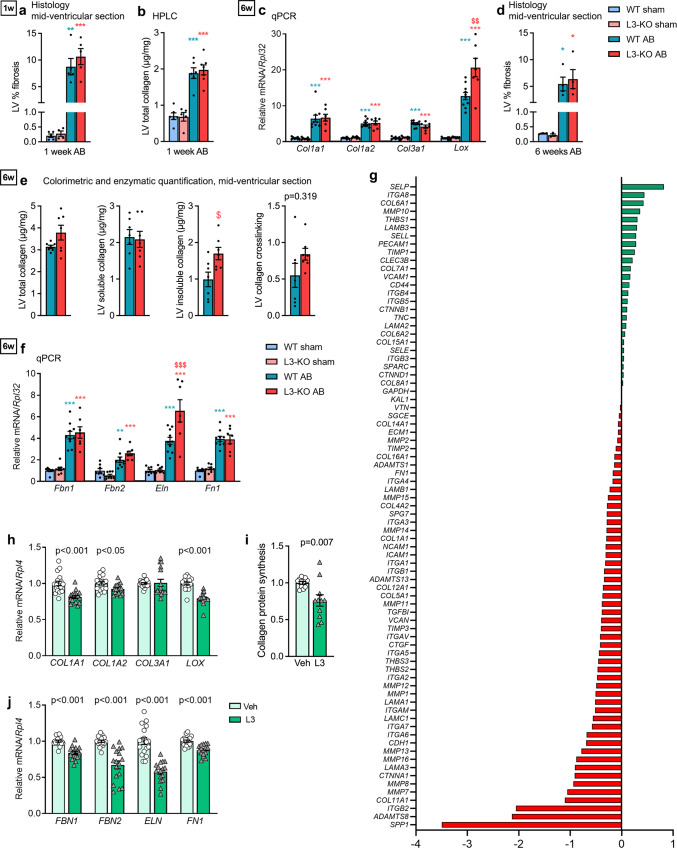
Fig. 5. ADAMTSL3 regulates deposition of insoluble collagen in the heart, and production of ECM molecules by cardiac fibroblasts in vitro.
a–f Wild-type (WT) and Adamtsl3 knock-out (L3-KO) mice were subjected to aortic banding (AB) or sham surgery for 1 and 6 weeks. a Left ventricle (LV) % total collagen, calculated from Picrosirius Red, Fast Green, and Alcian Blue (RGB)-stained histology mid-ventricular sections at 1 week post-AB (Sham: n = 5 WT and n = 5 KO, AB: n = 5 WT and n = 5 KO). b LV type-I collagen content, as measured by peak hydroxyproline HPLC, 1-week post-AB (Sham: n = 6 WT and n = 5 KO, AB: n = 6 WT and n = 7 KO). c LV mRNA/Rpl32 levels of collagens type I (Col1a1, Col1a2) and type III (Col3a1) and lysyl oxidase (Lox) (Sham: n = 8 WT and n = 8 KO, AB: n = 10 WT and n = 7 KO). d LV % total collagen in mid-ventricular sections at 6 weeks post-AB (Sham: n = 3 WT and n = 3 KO, AB: n = 4 WT and n = 4 KO). e Levels of total collagen, soluble collagen, insoluble collagen and collagen crosslinking in LVs 6 weeks post-AB, using colorimetric and enzymatic procedures on mid-ventricular sections (n = 7 WT and n = 7 KO). (f) mRNA/Rpl32 levels of fibrillin-1/2 (Fbn1, Fbn2), tropoelastin (Eln1) and fibronectin-1 (Fn1), in L3-KO vs WT (Sham: n = 8 WT and n = 8 KO, AB: n = 10 WT and n = 7 KO). Statistical analyses were performed using the one-way ANOVA with Tukey’s multiple comparisons test (a–d, f) or the Student’s t-test (e). P-values are reported as exact p-values or *p < 0.05, **p < 0.01, and ***p < 0.001 for AB vs. sham, and $p < 0.05, $$p < 0.01, and $$$p < 0.001 for L3-KO AB vs. WT AB. g–h, j Human foetal cardiac fibroblasts (hfCFBs) were cultured for 7 days, producing a rich extracellular matrix (ECM) network, and transduced with ADAMTSL3 (L3) or control (vehicle, Veh) adenovirus on day 4. Data represent experiments in 3 different cell passages. g ΔΔCT expression values, normalized to GAPDH, of 53 downregulated and 25 upregulated genes in pooled L3 vs Veh mRNA samples (n = 18 in both groups) using an expression array of 78 cell adhesion and ECM-related genes. h mRNA/RPL4 levels from qPCR of COL1A1, COL1A2, COL3A1, LOX in L3 (n = 16) vs Veh (n = 18). i Collagen protein synthesis, as measured by radioactive decay (counts per minute) of [3H]-proline, incorporated over 48 h in L3 and Veh CFBs, isolated from 1-3 day-old rats (n = 3 isolations with n = 60 hearts giving n = 3-4 technical replicates per isolation). j mRNA/RPL4 levels from qPCR of FBN1, FBN2, ELN and FN1 in L3 (n = 16) vs Veh (n = 18) hfCFBs. Statistical analysis was performed using the Student’s t-test (h-j). All data (except g) are shown as individual value scatterplots with mean ± SEM.

