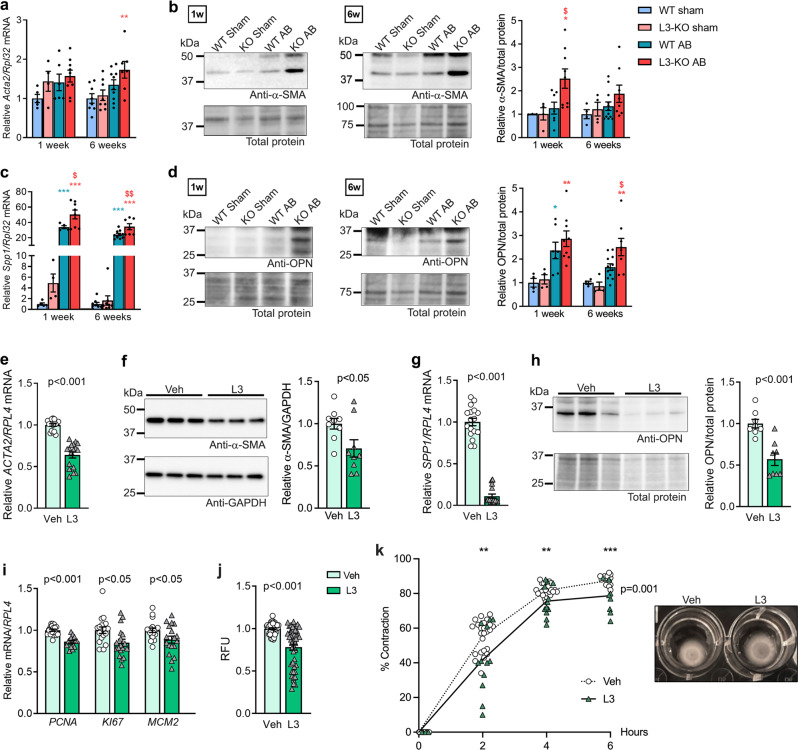
Fig. 6. ADAMTSL3 regulates cardiac myofibroblast differentiation in vivo and in vitro.
a–d Wild-type (WT) and Adamtsl3 knock-out (L3-KO) mice were subjected to aortic banding (AB) or sham surgery for 1 and 6 weeks. a mRNA/Rpl32 levels of α-smooth muscle actin (α-SMA, Acta2). b Representative immunoblots and quantification of α-SMA in LV protein extracts of WT and L3-KO 1 and 6 weeks post-AB or sham surgery. c mRNA/Rpl32 levels of osteopontin (OPN, Spp1). d Representative immunoblots and quantification of OPN in LV protein extracts of WT and L3-KO 1 and 6 weeks post-AB or sham surgery. At 1-week post-AB, n = 4-5 WT and n = 4 KO sham, and n = 6–7 WT and n = 8–9 KO AB. At 6 weeks post-AB, n = 4-8 WT and n = 4-8 KO sham, and n = 10-12 WT and n = 7-8 KO AB. Statistical analyses were performed using the one-way ANOVA with Tukey’s multiple comparisons test (a-d). P-values are reported as *p < 0.05, **p < 0.01, and ***p < 0.001 for AB vs. sham, and $p < 0.05, $$p < 0.01, and $$$p < 0.001 for L3-KO AB vs. WT AB. e–k Human foetal cardiac fibroblasts (hfCFBs) were cultured for 7 days, producing a rich extracellular matrix (ECM) network, and transduced with ADAMTSL3 (L3) or control (vehicle, Veh) adenovirus on day 4. Experiments were performed at 3 different cell passages. e ACTA2/RPL4 levels in L3 (n = 16) vs Veh (n = 18). f Representative immunoblot and quantification of α-SMA/GAPDH in L3 (n = 8) vs Veh (n = 8). g SPP1/RPL4 levels in L3 (n = 16) vs Veh (n = 18). f Representative immunoblot and quantification of OPN/total protein in L3 (n = 8) vs Veh (n = 8). i mRNA levels/RPL4 of proliferating cell nuclear antigen (PCNA), marker of proliferation Ki-67 (KI67) and mini-chromosome maintenance complex component 2 (MCM2) in L3 (n = 18) vs Veh (n = 18). j Relative fluorescence units (RFU) reflecting EdU incorporation, as a measure of proliferation, in L3 vs Veh (n = 48). Data are given with mean ± SEM (a–j). k Collagen gel contraction of hfCFBs, as % contraction of initial gel area, at 2, 4 and 6 h, in L3 (n = 12) vs Veh (n = 24). Statistical analysis was performed using the Student’s t-test (p–k), with p-values reported as numerical values (e–j) or **p < 0.01 and ***p < 0.001, and the two-way repeated measures ANOVA with the Geisser-Greenhouse correction for comparison of multiple time-points (k, exact p-value shown in graph).

