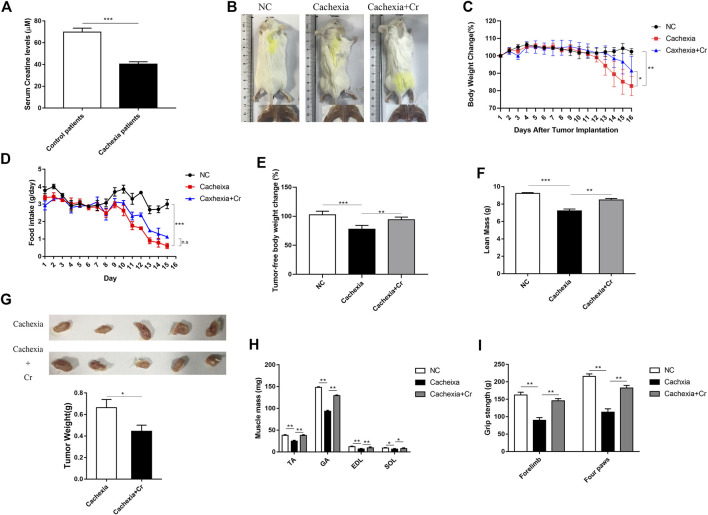
FIGURE 1.
Creatine supplementation protects against experimental cancer cachexia. (A) Measurement of creatine levels in the serum from non-cachectic patients and cachexia patients. ***p < 0.0001 denoted non-cachectic patients and cachexia patients. (B) Representative general images and skeletal muscle images of the three groups. NC group: normal control mice, cachexia group: C26 tumor-bearing mice, cachexia + Cr group: Creatine-treated C26 tumor-bearing mice. (C) Body weight changes in the three groups (mean ± SD, n = 6). Day 0: Tumor implantation. Day 7: Creatine injection began. Day 15: Terminal day. **p < 0.01 denoted the NC group versus the cachexia group, *p < 0.05 denoted the cachexia group versus the cachexia + Cr group. (D) Daily food consumption in the three groups during the course of the experiment. (mean ± SD, n = 6). ***p < 0.001 denoted the NC group versus the cachexia group. There was no significant difference between the cachexia group and the cachexia + Cr group. (E) Tumor removal weight changes in the three groups (mean ± SD, n = 6). ***p < 0.001 denoted the NC group versus the cachexia group, **p < 0.01 denoted the cachexia group versus the cachexia + Cr group. (F) The lean mass changes in the three groups (mean ± SD, n = 6). ***p < 0.001 denoted the NC group versus the cachexia group, **p < 0.01 denoted the cachexia group versus the cachexia + Cr group. (G) The tumor weight changes in the cachexia group and the cachexia + Cr group (mean ± SD, n = 6). *p < 0.05 denoted the cachexia group versus the cachexia + Cr group. (H) Skeletal muscle masses of tibialis anterior (TA), gastrocnemius (GA), extensor digitorum longus (EDL) and soleus (SOL). Data are shown as the mean ± SD, n = 6, **p < 0.01, *p < 0.05. (I) Skeletal muscle strengths were determined based on the grip strength of the forelimbs and four paws. Data are shown as the mean ± SD, n = 6, **p < 0.01.

