Figure 2.
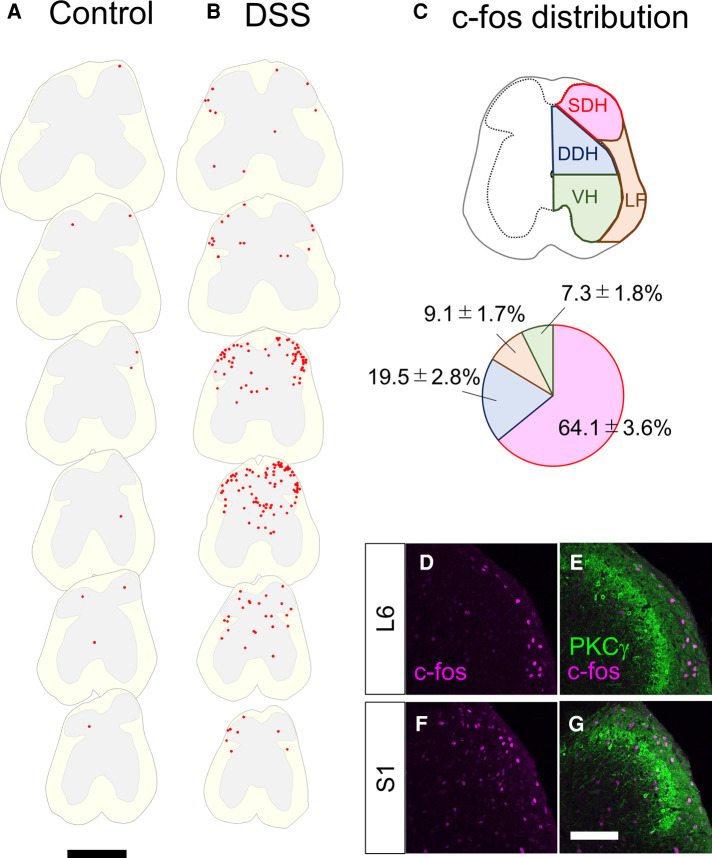
c-fos-positive cells in the lumbosacral spinal cord in control and DSS-treated, mice. (A,B) Distribution of c-fos-positive cells. c-fos immunostaining on the transverse sections of the lumbosacral spinal cords in 0% DSS-treated (A) and 2% DSS-treated (B) mice was performed, and distribution of c-fos-positive cells on six sections (20 µm in thickness, 800 µm apart each other) from the lumbar (∼L5, top) to the sacral (∼S2, bottom) spinal cords in a representative mouse in each condition is shown. c-fos-positive cells are shown as red dots. White and gray matters in each section are shown in light yellow and grey colors, respectively. Scale, 500 µm. (C) Distribution pattern of c-fos-positive cells. The spinal cord was divided into the shallow dorsal horn (SDH), deep dorsal horn (DDH), ventral horn (VH), and lateral funiculus (LF) (see Methods). The distribution of c-fos-positive cells in these areas in DSS-treated mice (n = 4 mice, 1,205 cells) is shown in the pie chart. (D–G) Transverse sections of the spinal dorsal horn of DSS-treated mice were immunostained with anti-c-fos (magenta) together with anti-PKCγ (green) antibodies. Images on the right dorsal horn around L6 (D,E) and S1 (F,G) segments are shown. Scale, 100 µm.

