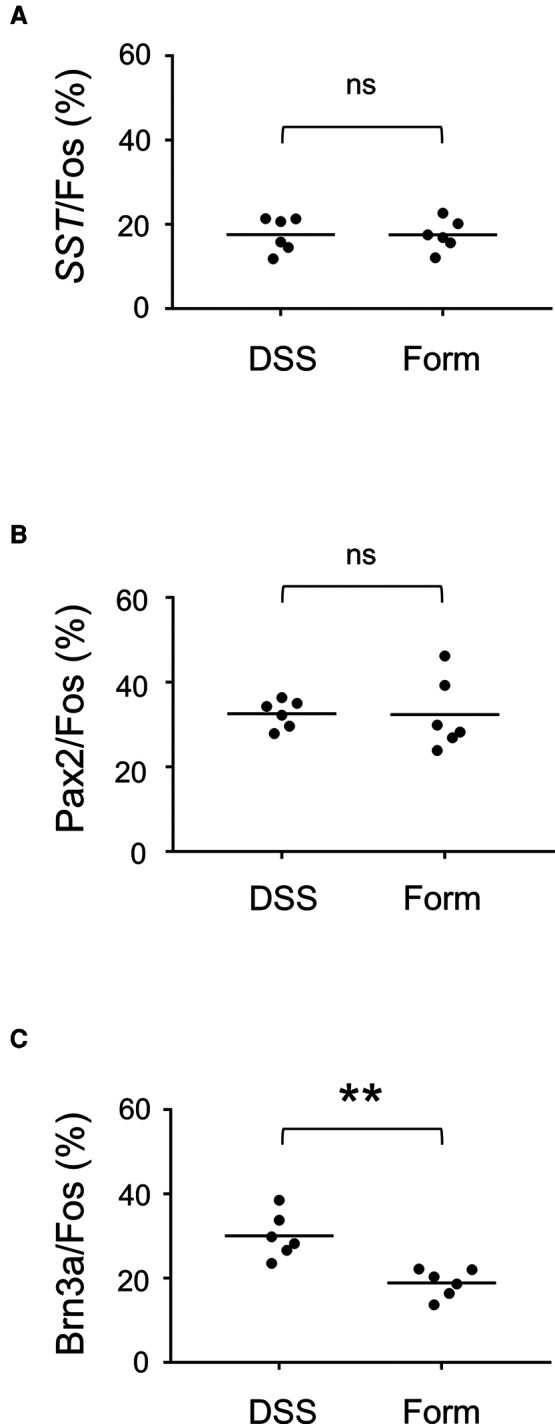
Figure 4.

Percentage of SST-, Pax2-, and Brn3a-positive cells among c-fos-positive cells. (A) The percentage of SST-positive cells among c-fos cells (17.6 ± 1.7%, n = 6 DSS-treated mice, 573 cells; 17.5 ± 1.5%, n = 6 formalin-injected mice, 898 cells) is shown. (B) The percentage of Pax2-positive cells among c-fos cells (32.6 ± 1.3%, n = 6 DSS-treated mice, 1,872 cells; 32.4 ± 3.5%, n = 6 formalin-injected mice, 1,592 cells) is shown. (C) The percentage of Brn3a-positive cells among c-fos cells (30.1 ± 2.2%, n = 6 DSS-treated mice, 1,379 cells; 18.9 ± 1.4%, n = 6 formalin-injected mice, 1,573 cells) is shown. Horizontal bars indicate the median. Data were analyzed by the Mann-Whitney U test. “ns” means non-significant. **p < 0.01.
