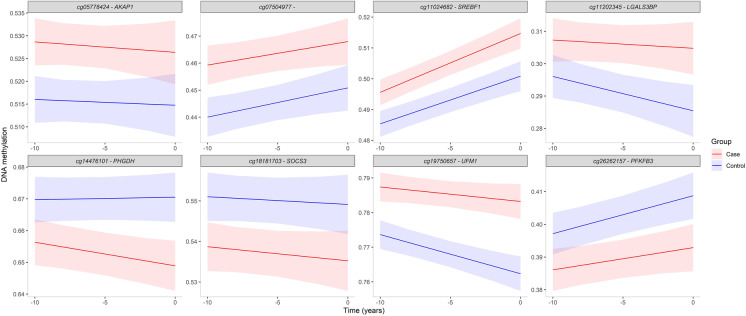
Fig. 3.
DNAm trajectories for eight CpG sites showing significantly (p < 0.05) different DNAm levels at each time point (T-10, T-5, and T0) between incident T2D cases and controls. Trajectories were extracted from linear mixed effects models adjusted for age at time of diagnosis (T0), sex, cell type proportion, and batch effects. Ribbons represent 95% confidence intervals

