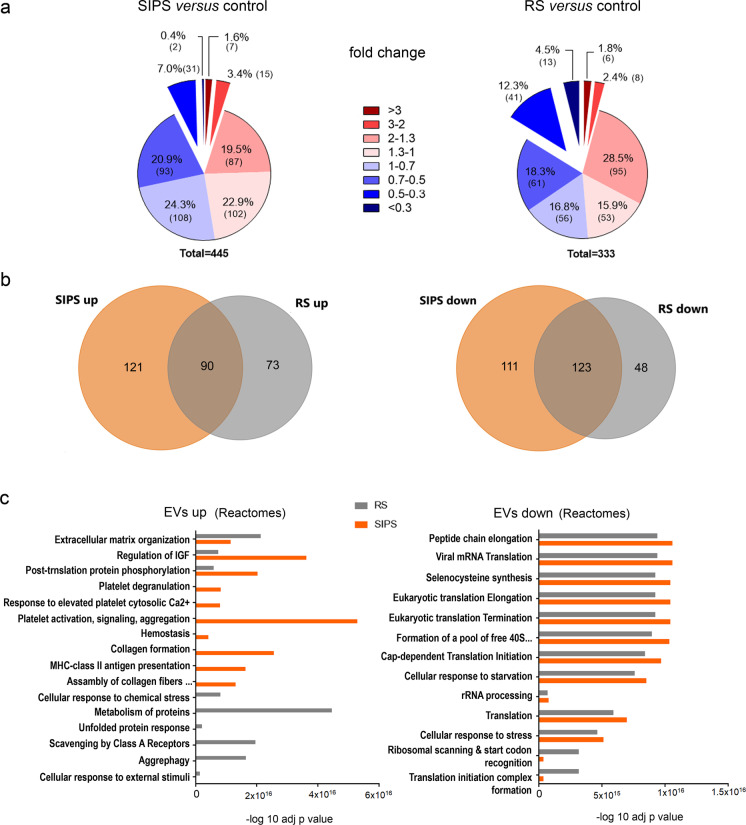
Fig. 2.
Comparative proteomic analysis of proteomes of EVs secreted by control and senescent VSMCs. a Pie charts presenting the distribution of fold changes (FC) in the level of proteins identified in EVs secreted by senescent cells relative to EVs from control cells (p < 0.05). b Venn diagrams of up and downregulated proteins identified in EVs from SIPS and RS cells that were significantly changed (p < 0.05); c Reactome pathway analysis of proteins that were upregulated (FC > 1.3) or downregulated (FC < 0.7) in EVs secreted by senescent VSMCs (SIPS and RS) comparing to EVs from young VSMCs. EVs from three independent biological experiments for each condition (control, SIPS, and RS) were subjected into proteomic analysis

